What hosts track
The numbers a real Airbnb spreadsheet has to handle
Most “best airbnb spreadsheet” lists online are Etsy roundups dressed up as buyer’s guides. The tabs all blur together: income tracker, expense tracker, all-in-one promised. We’ve looked at the spreadsheets that actually get used in working host operations and what they have in common is specific: real category granularity, a P&L view that doesn’t lie, and tax columns that match what hosts are filing.
Before naming picks, here’s the shape of the work the spreadsheet has to handle. Numbers below come from common host tax filings and the IRS Schedule E line set; treat them as the floor, not the ceiling.
Five picks below cover the five distinct shapes of that work. Not one of them is right for every host; the goal of the list is to make the self-select easy.
The arithmetic
How to calculate what an Airbnb listing actually earns
Every spreadsheet below is a wrapper around five calculations. Knowing them is what lets you judge a template instead of trusting it, because the failure mode of a bad summary tab is not an error message. It is a confident number that is wrong, and you only find out at filing time.
Start with the one most hosts skip: your payout is not your revenue. The nightly rate a guest sees and the figure that lands in your account are different numbers, and the gap is not a rounding difference. We keep the fee side worked out separately at our Airbnb host fee calculator, because it changes by listing type and it changes when Airbnb changes it. Everything below assumes you are starting from payout, not from list price.
| The formulafrom payout | What it answersand what it hides | |
|---|---|---|
| Effective nightly rate | payout ÷ nights booked | What one booked night is really worth to you. Hides how many nights sat empty. |
| Occupancy | nights booked ÷ nights available | How full the calendar ran. Says nothing at all about money, which is why it is the most over-quoted number in hosting. |
| Revenue per available night | payout ÷ nights available | The only one that compares two listings, or two months, honestly. |
| Break-even occupancy | fixed monthly costs ÷ (effective nightly rate × nights available) | The share of the calendar that pays the bills before any of it is profit. |
| Arbitrage margin | payout − rent − utilities − monthly furnishing recovery | Whether a leased unit clears. Negative here is common in year one and is not by itself a reason to quit. |
Revenue per available night is the one worth building your sheet around. Occupancy and nightly rate can each be made to look good at the other’s expense: drop your price far enough and the calendar fills, hold it high enough and the rate reads well on an almost empty month. Dividing payout by every night you were open to bookings, booked or not, is the number neither trick survives.
Break-even occupancy is the figure to run before a season rather than after it. If your fixed costs are covered at 40 per cent of the calendar, a soft month is a shrug. If they need 80 per cent, you are running a business with no margin for a boiler replacement, and the spreadsheet should be telling you that in September, not in January.
On format, both work and the choice is not close enough to agonise over. Google Sheets wins when a co-host or an accountant needs the same file you are looking at, and its array formulas keep a per-booking tab feeding a summary without a manual refresh. Excel wins on speed once you are past three or four listings and living in pivot tables. Every pick below is available in at least one of the two, and four of the five in both.
If you are still pre-launch, none of these five calculations has inputs yet, and a budget model is the thing you actually need. That is a different sheet with a different job, and we keep it separate at our Airbnb startup cost spreadsheet rather than bolting an estimate tab onto an operations file.
Side-by-side
The 5 picks, side by side
What each pick is best at and what it isn’t. Only the first column is a product we can price for you, because it is ours; the other four are shapes, and what they cost depends on whose file you start from. Detailed write-ups below; the table is for skim-reading.
| Templacity$49 | A free Sheets build$0 | Expense-onlythe shape | Pre-launch modelthe shape | Multi-listingthe shape | |
|---|---|---|---|---|---|
| Best for | One to three properties | New hosts on zero budget | An expense side that is a shoebox | Deciding whether to launch | Four listings and up |
| Format | Google Sheets and Excel | Google Sheets | Either | Either | Either |
| Expense categories built in | Categories + receipts column | Usually one lumped column | Its whole point | Estimates, not actuals | Per listing |
| Entry | Manual, by design | Manual | Manual | Assumptions you set | Manual, or exported |
| Summary view | Monthly + annual roll-up | Income only | Expenses only | Break-even projection | Per-listing + portfolio |
Pick 1
Templacity Airbnb Spreadsheet, best all-in-one host P&L
Our own pick. We’d be lying if we didn’t lead with it on a list called “best airbnb spreadsheet” since this is what we built it for. We’ll be honest about where it isn’t the right fit too.
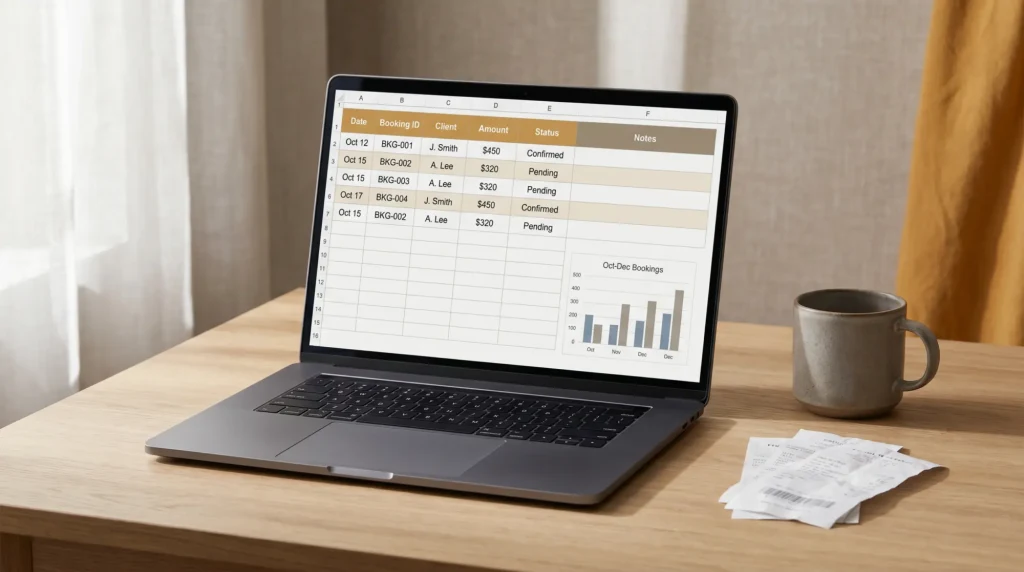
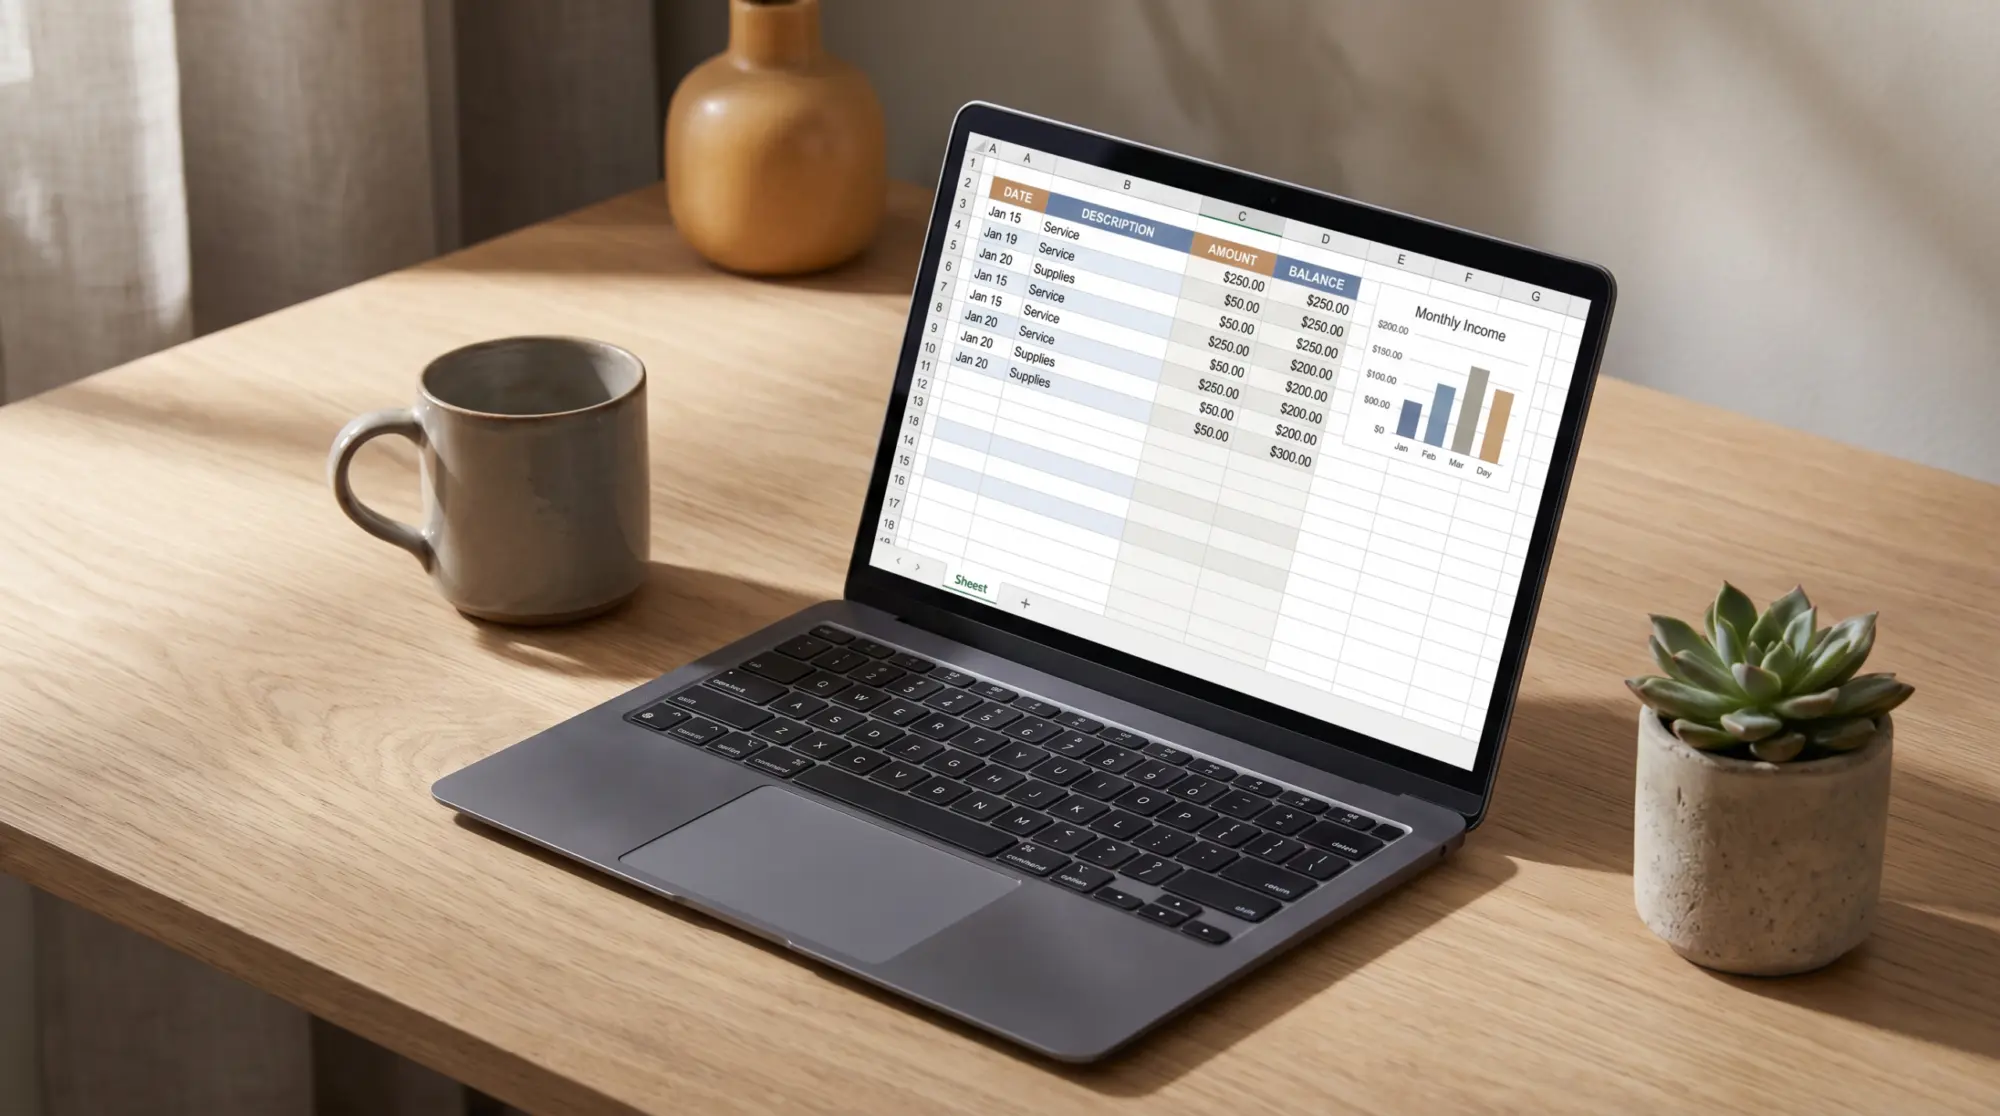
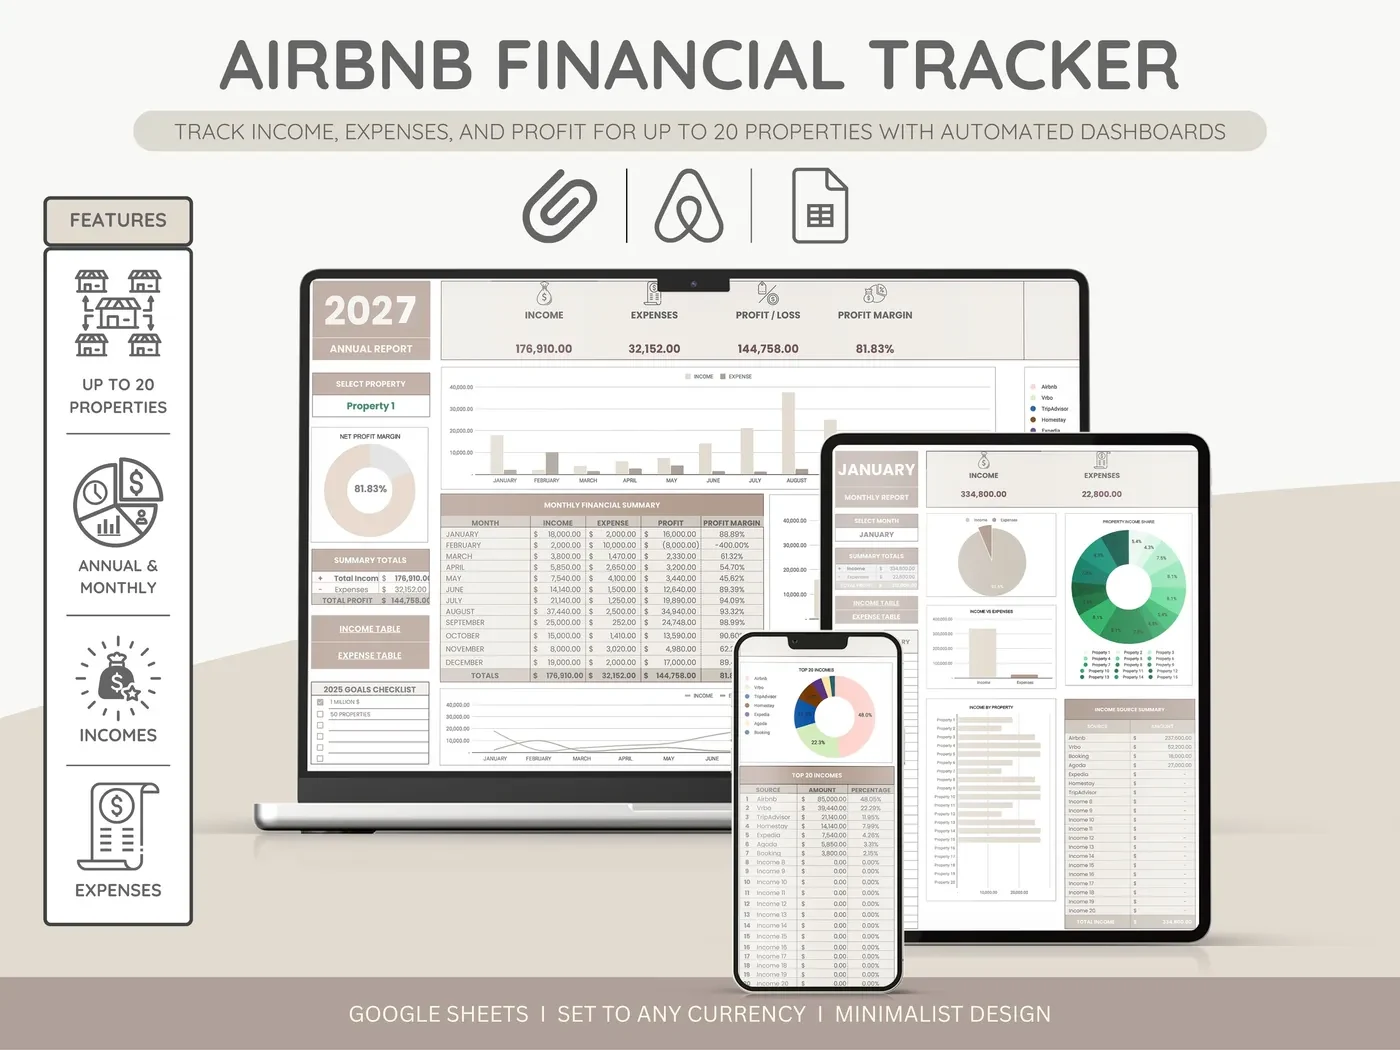
Best at: turning a year of bookings into a sentence. Six worksheets hand off to each other: income by booking with the source platform tagged, expenses with vendors, categories and a receipts column, turnover costs so you can see cost per stay, then a monthly summary and an annual roll-up that carry net rather than gross. The formulas are already in place. Three palettes (Brown, Black, Pink) with identical fields, so the choice is only which one you’ll open on a Sunday night. $49 once, and the file opens in Google Sheets or Excel.
Not best at: anything automatic. There is no calendar sync and no import from Airbnb’s end; entries are manual on purpose, which some hosts read as a feature and others as a chore. It is built for one to three properties, so a portfolio rollup is the wrong ask, and it does not convert currencies, so international hosts should enter one base currency and keep it. It also isn’t a tax return: the categories are host categories, and mapping them to Schedule E lines is a step you or your accountant still take.
For who: a host with one to three listings who wants the same file open year-round, fills it in as bookings land, and wants the year-end view to be a page they can read rather than a report they have to build.
What’s inside
The Templacity Airbnb Spreadsheet
- Google Sheets
- Excel
- Brown, Black or Pink
Best for the host with one to three properties who wants to know how the year actually went.
- Dates
- Nights
- Rate
- Source platform
- Vendor
- Category
- Amount
- Receipt link
- Cleaning
- Supplies
- Small repairs
- Cost per stay
- Net and gross
- Cleaning recouped
- Occupancy
- Top three costs
- Year net
- Year over year
- Guest preferences
- Fix list
6 worksheets, 1 workbooksame fields in all three palettes · formulas pre-built, entry manual
Worksheet list and price checked 31 July 2026 See the spreadsheet
Worth saying plainly, because the category is full of screenshots that imply otherwise: nothing in that list talks to Airbnb. Ours is a file you type numbers into, and the honest version of the pitch is that the typing is where the patterns land. If a spreadsheet you are looking at does claim a live feed from your listing, read carefully what is doing the feeding before you pay for it.
A free template with one lumped Expenses column costs more at filing time than a paid one with real categories and a receipts link.The expensive lesson hosts learn late
Pick 2
Best free option for new hosts
If the listing is brand new, revenue is zero, and paying for a spreadsheet feels premature, the right move is a free Google Sheets template. We’ve documented building one from scratch at Airbnb Google Sheets template, free build, and the broader Google Sheets options at Airbnb Google Sheets template.
Best at: zero cost, zero install, easy to share with a co-host or accountant, and most templates load in any browser. Good enough for the first 6-12 months while the data shape settles.
Not best at: most free templates are missing tax categories entirely, or have them as a single “Expenses” column rather than line-itemed against Schedule E. The first time a host files taxes off a free template, the manual rework usually costs more in time than a paid template would have. They also rarely include host-fee math, which means the income column overstates real revenue.
For who: first listing, first 6 months, no income to speak of yet. Move to a paid template once you’ve filed taxes once and know which line items you actually use.
Pick 3
Best for tracking expenses and host fees
Some hosts already have an income tracker that works (Airbnb’s own export, or a CRM, or a co-host’s tool). What they’re missing is a granular expense-side spreadsheet that survives a tax audit. The expense-focused pick lives at Airbnb expense spreadsheet, with the host-fee math worked out at Airbnb host fee calculator.
Best at: deductible category granularity (cleaning, supplies, utilities, internet, insurance, depreciation, mortgage interest if owner-occupied, repairs vs improvements split, mileage, professional fees). Receipt photo column. Year-end totals organized for an accountant.
Not best at: doesn’t model occupancy or pricing. If revenue is the question you’re trying to answer, this isn’t the tool.
For who: a host whose income tracking is already handled but whose expense side is a shoebox of receipts. Pairs cleanly with Airbnb’s native earnings export.
Pick 4
Best for the startup-cost and ROI question
For hosts evaluating whether to launch a property at all, the spreadsheet shape is different: pre-revenue, pre-expense, pre-everything. The job is modeling. Our breakdown of the startup-cost side lives at Airbnb startup cost spreadsheet, and the ROI math at Airbnb ROI spreadsheet. The full pre-launch projection lives at Airbnb proforma.
Best at: furnishing budget, one-time setup costs (linens, photography, smart locks, signage), break-even analysis on the first 6 months, occupancy assumptions tested against local data, mortgage and insurance modeling.
Not best at: ongoing operations. Once the listing goes live and real bookings start, you’ll want one of the other picks above. The startup template’s job is done in the first 90 days.
For who: a host who hasn’t launched yet, or one who’s adding a second listing and re-running the math.
Pick 5
Best for a portfolio of two-plus listings
Once a host has more than one listing, single-tab spreadsheets stop scaling. The right shape is per-listing tabs that roll up to a portfolio summary. Our take on this lives at Airbnb property management spreadsheet, with income-side rollup also covered at Airbnb income spreadsheet.
Best at: per-listing P&L tabs, portfolio rollup tab that aggregates revenue, expenses, occupancy, and net across all listings. Year-over-year comparison columns. Per-listing tax categories that flow up to a single Schedule E summary.
Not best at: one-listing simplicity. If you have a single listing, this template’s overhead (tabs you’ll never fill, formulas that reference other tabs) is friction.
For who: hosts running 2-10 listings who want one file to manage them all. Property managers running a small book.
For the broader airbnb hub with all our spreadsheet, calculator, and operations content, see Airbnb.


Everything you hand a guest, matched and priced to move together.
Verdict
The call we’d make on the best Airbnb spreadsheet
FAQ
Common questions, answered briefly
What’s the best spreadsheet for tracking Airbnb income and expenses?
Are there free Airbnb spreadsheet templates that actually work?
What categories should an Airbnb expense spreadsheet have?
Excel or Google Sheets, which is better for Airbnb hosting?
Do I need a different spreadsheet if I have multiple listings?
If yours isn’t above, drop the question in the comments and we’ll add it.
People also ask