№ · Airbnb Spreadsheet
Every booking, every property, one sheet.
One spreadsheet, three palettes, same fields and same formulas. Built for the host with one to three properties who wants to know how the year actually went, not optimise a portfolio.
Instant download · Google Sheets compatible · Permanent link in your account.
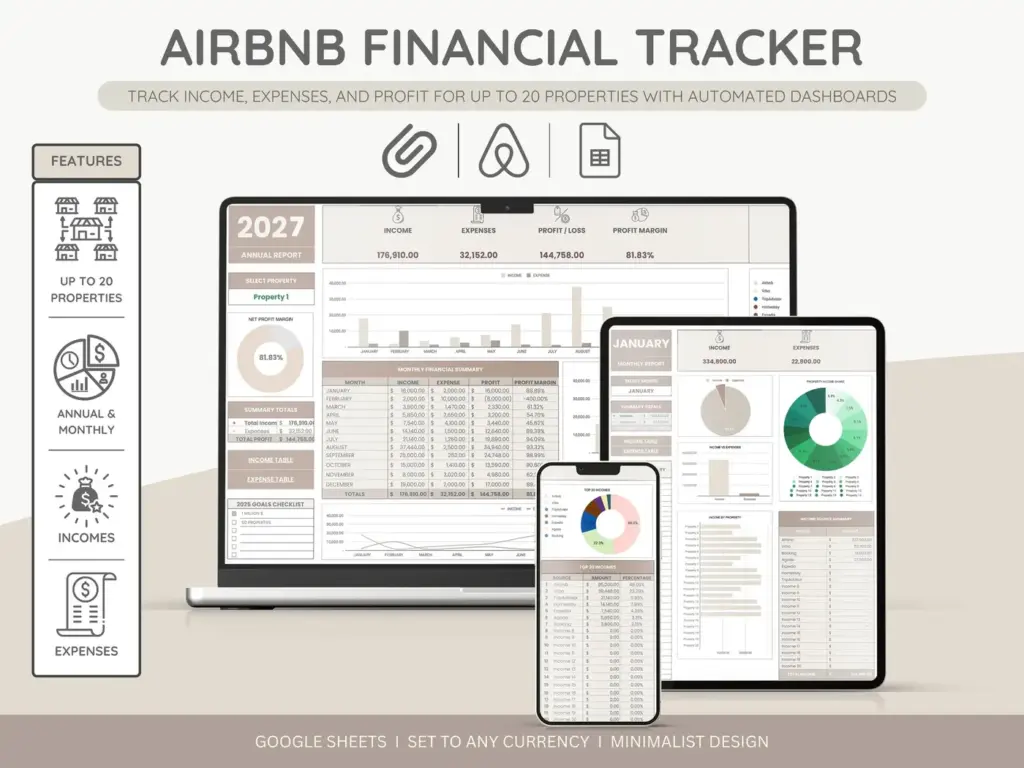
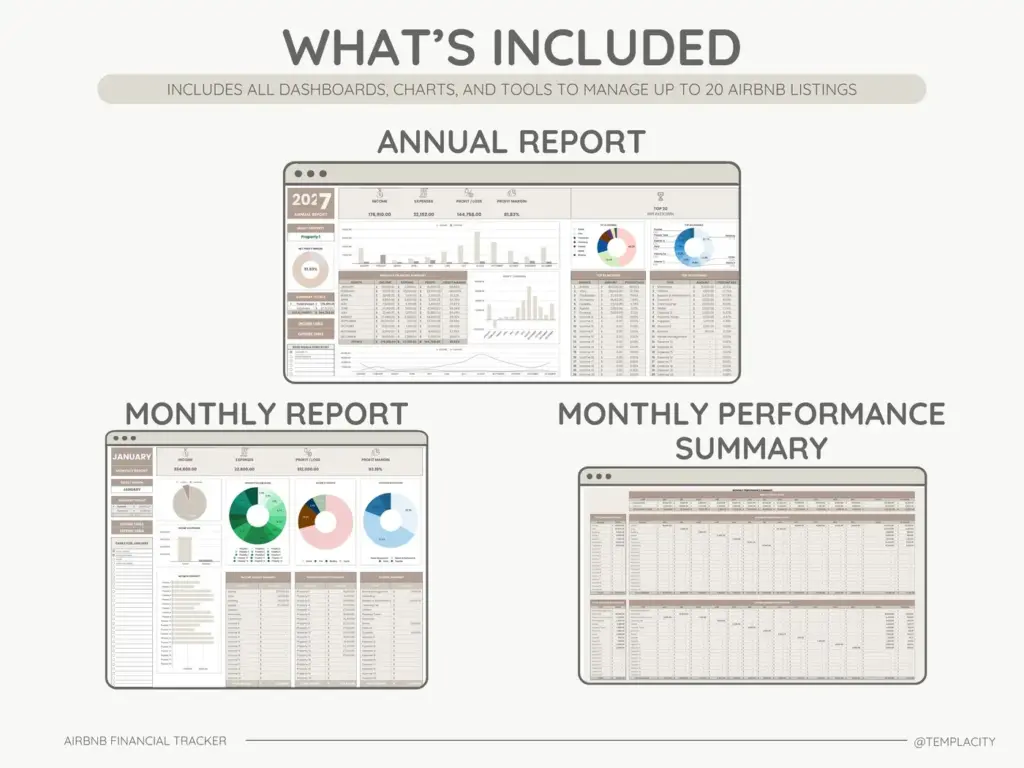
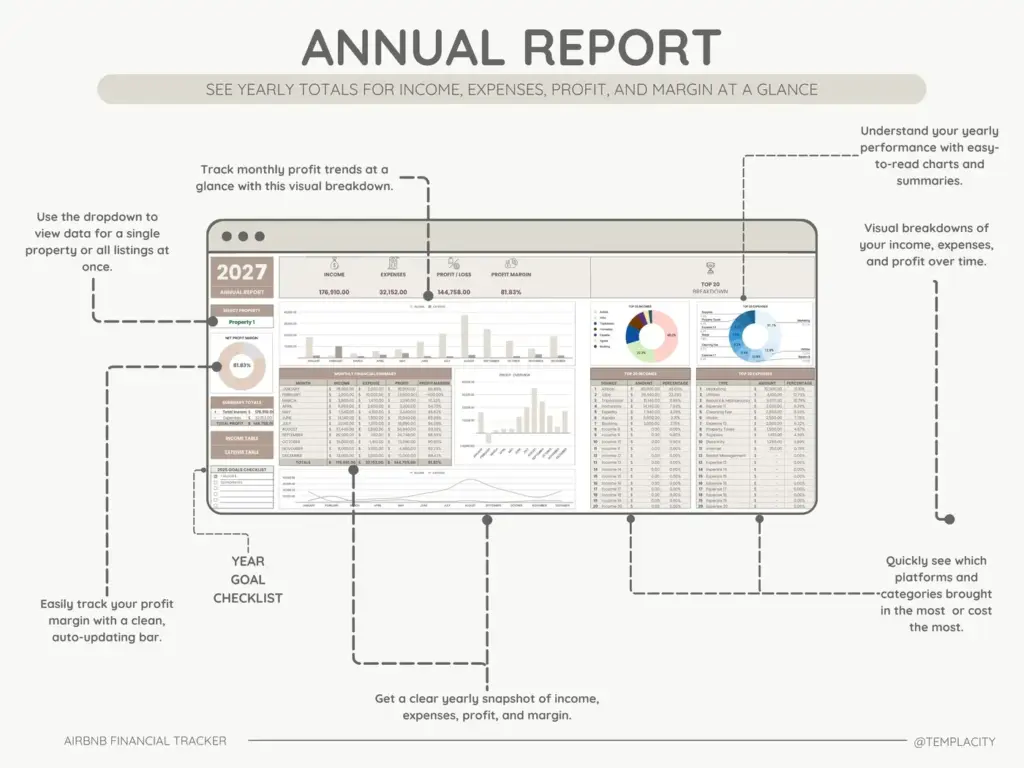
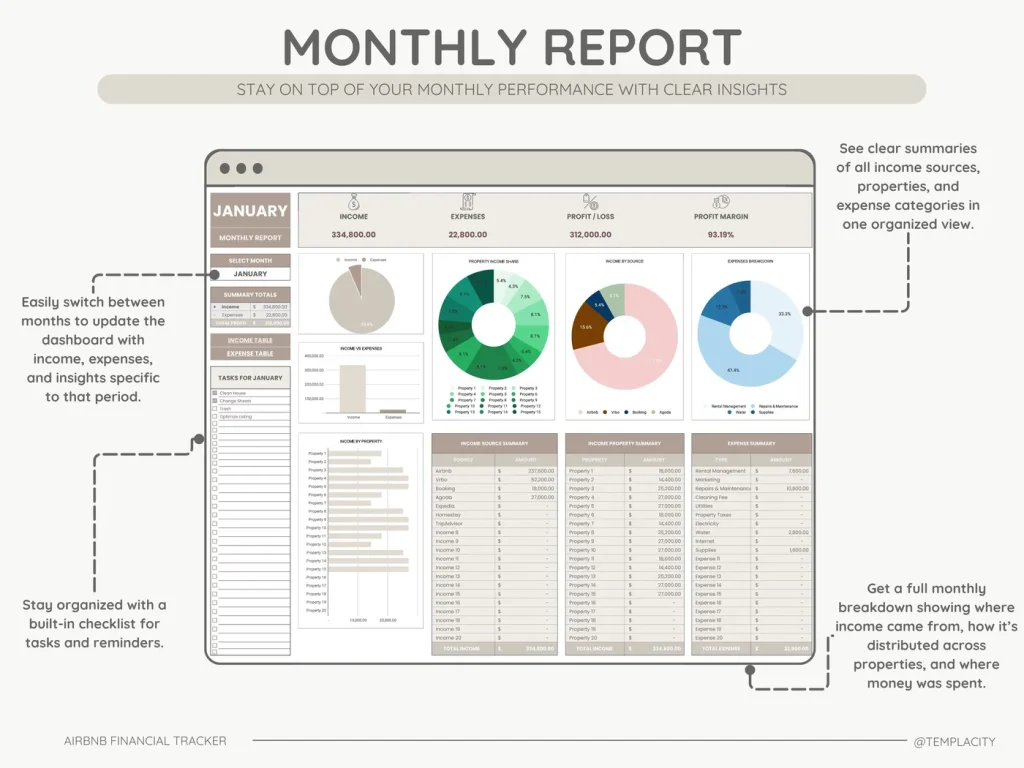
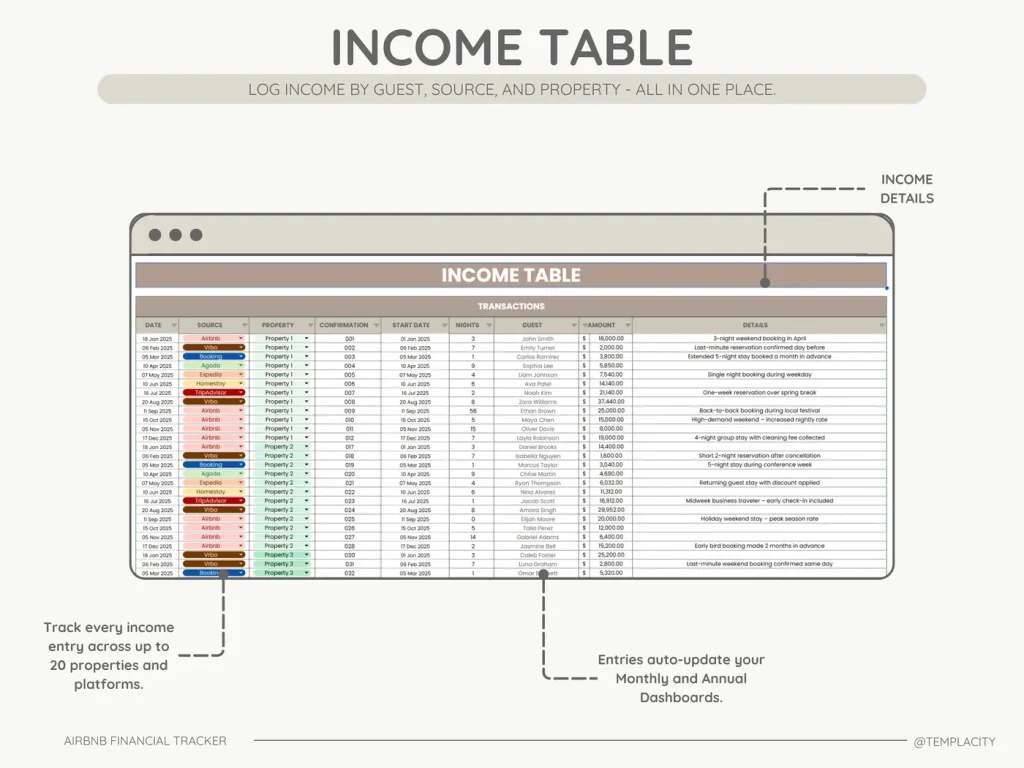
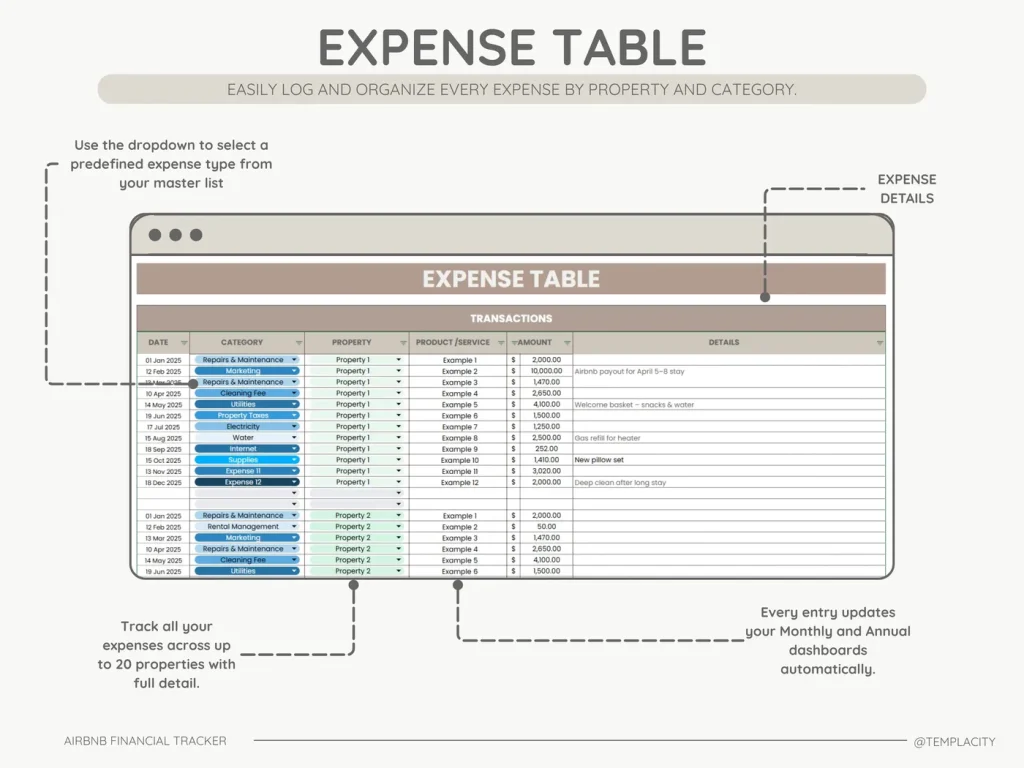
- i. Income, expenses, occupancy: one tab reads all three
- ii. Pre-built formulas, no setup, no broken cells
- iii. Google Sheets and Excel compatible
- iv. Permanent link in your account, no subscription
№ 01 · Why this exists
Most host spreadsheets are designed for property managers, not hosts.
The free Airbnb earnings export is the bare minimum. The big property-management tools are built for someone running thirty units and a cleaning crew. Between the two there’s a gap: the host with a couple of listings who just wants a clear view of what came in, what went out, and what’s left.
This is built for that gap. Six worksheets that hand-off to each other, formulas already in place, a monthly summary that turns a year of bookings into a sentence: net of $X across Y nights, with Z% occupancy. Then it gets out of the way.
№ 02 · What’s inside
Six worksheets, one workbook.
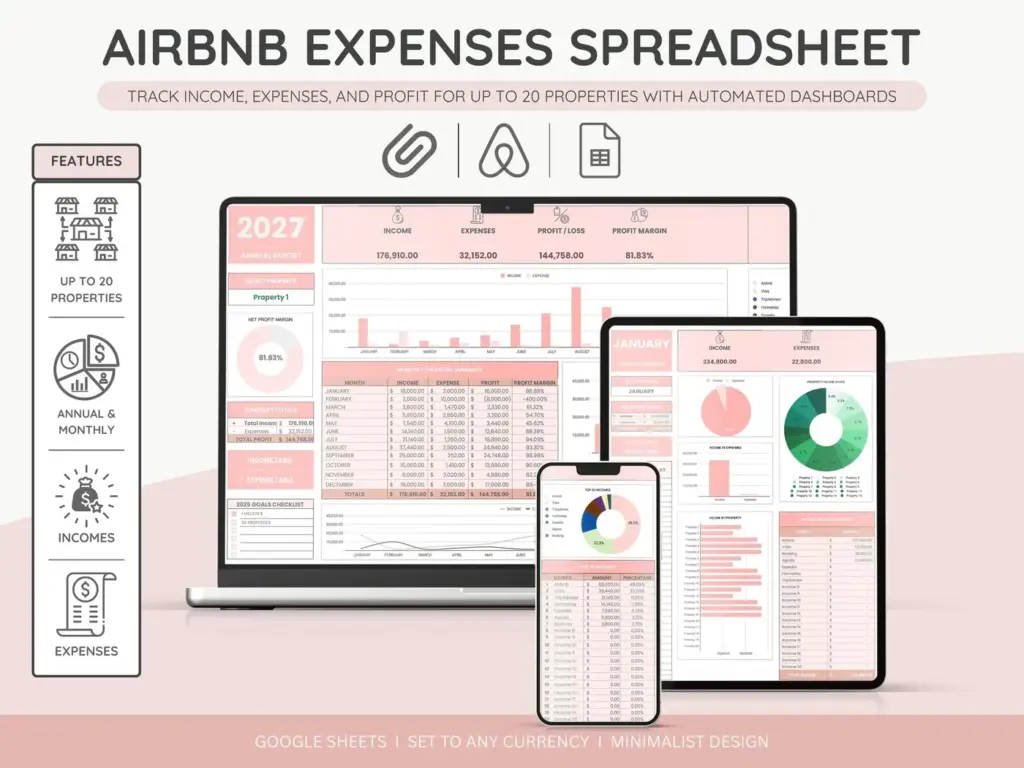
The fields that earn their line, none of the ones that don’t. Every variant has the same fields; only the palette differs.
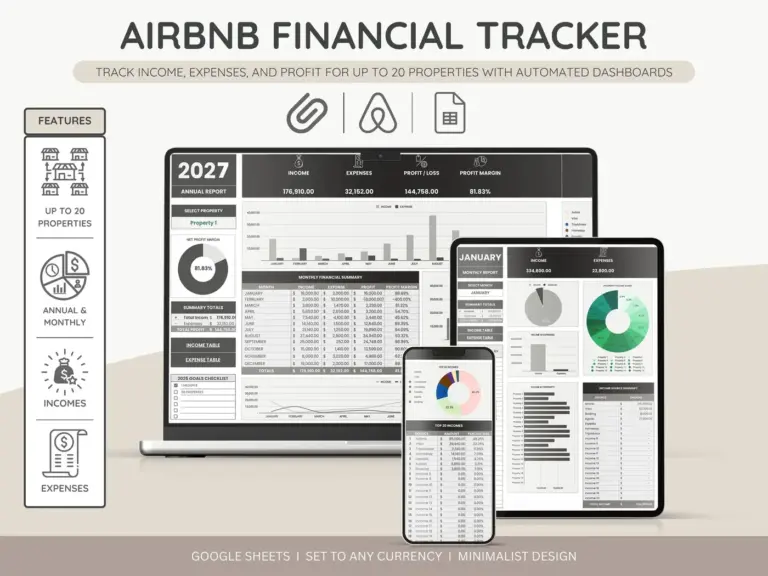
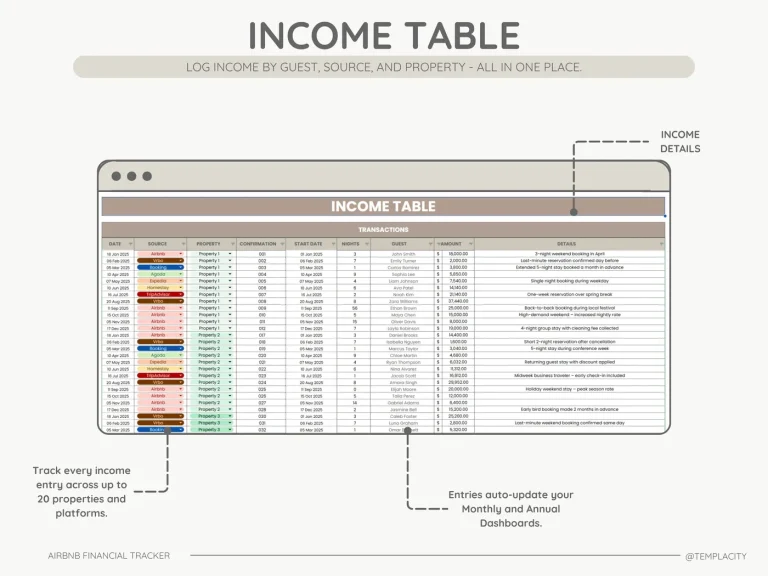
Bookings, rates and source platform; one tab to scan the year.
Vendors, categories, and a receipts column that links to your folder.
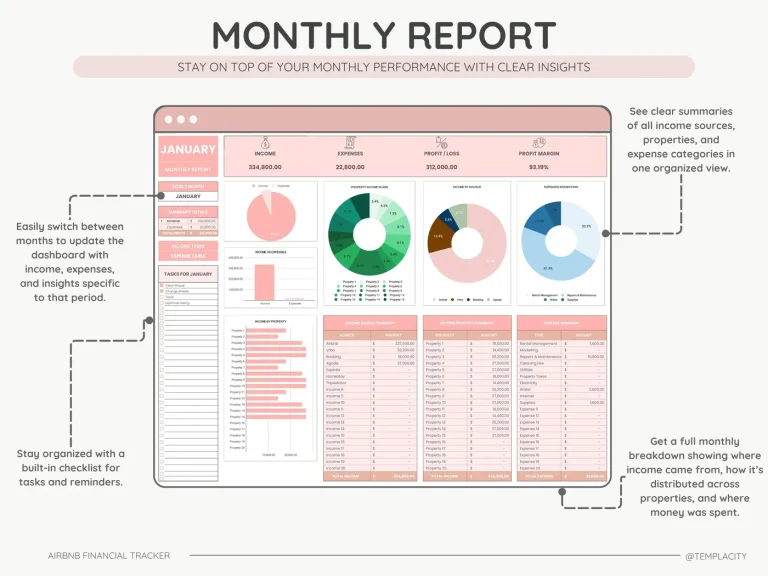
Your numbers, in 30 seconds. Net per month, not just gross.
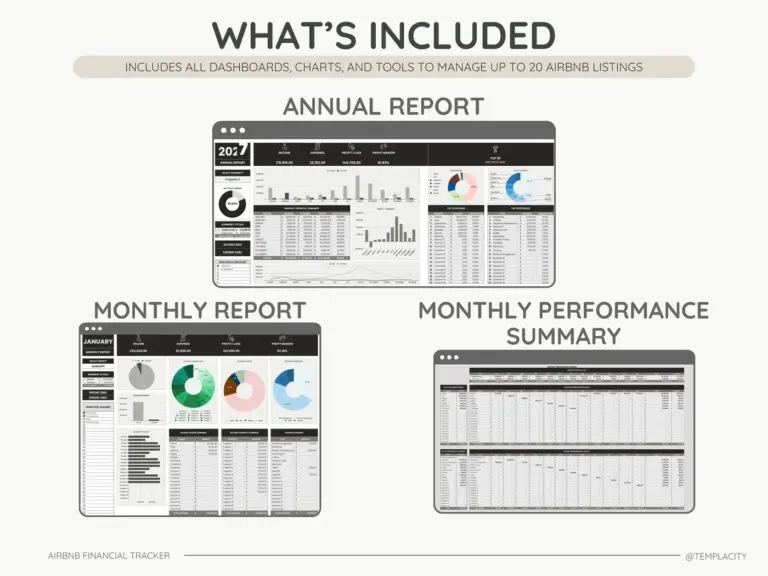
What the year actually added to. Year-over-year comparison built in.
Cleaner, supplies and small repairs; a running cost per stay.
Guest preferences, what worked, what to fix before next season.
№ 03 · The dashboard worksheet
Your numbers, in thirty seconds.
The monthly summary is the page you’ll open the most. Net per month, not just gross. Occupancy as a number you can act on, not a chart you have to read. Three categories carry 80% of expenses, so they’re called out; the rest stays one click away.
- i. Net + gross + cleaning recouped, all on one row.
- ii. Occupancy rate, against last month and same month last year.
- iii. Top three expense categories, called out.
- iv. A field for one sentence about the month, because patterns live there.
№ 04 · Choose your colour
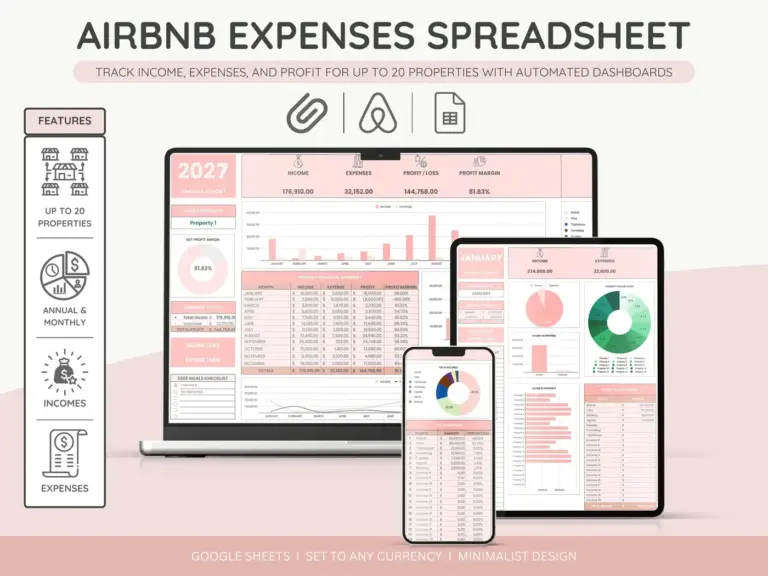
Three palettes, same workbook.
Pick the one you’ll actually open at the kitchen table on a Sunday night. The fields are identical; copy entries between them if you change your mind.
№ 05 · How it lands in your sheet
Three steps, less than a minute.
i.
Download.
Instant download after purchase. Permanent link in your account, too.
ii.
Open.
Google Sheets: File → Import → Upload, replace spreadsheet. Excel: open the file directly.
iii.
Enter your first booking.
Income tab, top row. The summary worksheet updates as you type.
We built this for hosts who want the numbers and nothing else. No goal trackers, no profit-per-pillow dashboards. Just the lines you’d hand an accountant without a word of explanation.
№ · Bought together
Add the rest of the set.
All four, the full set
$99
was $128
All four goes in as the Airbnb Superhost Bundle at $99, not four separate items. You keep $29.
№ 99 · Questions
Things you’ll want to know.
Will it work for a non-Airbnb let (Vrbo, direct, Booking)?
Yes. The Source field lets you tag any platform, and the formulas don’t care which one. Occupancy and net work the same regardless of where the booking came from.
Is this Google Sheets only, or does it work in Excel?
Both. The file is a Google Sheets export that opens cleanly in Excel; formulas survive the round-trip.
Do I need spreadsheet skills to use it?
No. Every formula is pre-built. You enter bookings and expenses; the summary, occupancy and roll-up update themselves.
Can I switch colours later?
Yes. The file is small enough that copying entries between palettes takes about a minute. Or email and we’ll send the other variants for free; the colour key lives in the order, not the file.
Does it sync with Airbnb automatically?
No. Entries are manual, by design. Hosts who actually use these spreadsheets tell us the moment of typing in a booking is when patterns start to land. An auto-import would skip that step.
№ · Last word
Get the spreadsheet.
$49 once. One file. Pick a colour, open it tonight.
$49
Add to cart
№ · Reviews
Be the first to say something.
Nobody has written about this one yet. If it is on your device, yours is the first thing the next person reads.
Instant download.
Your file is in your account the moment you check out, yours to re-download any time. A receipt lands in your inbox, too.
One-time purchase.
No subscription, no annual renewal, no upgrade nags. Pay once and the file is yours.
Quiet, secure checkout.
Stripe. Apple Pay. No spam, no “partners,” no reselling your details. Receipt, file, done.