The formula
How to calculate an Airbnb occupancy rate
The arithmetic is trivial and the definition is not. An Airbnb occupancy rate is booked nights divided by some larger number of nights, expressed as a percentage. Everything interesting is hiding in which larger number you chose.
Take a thirty-night month. You took twelve bookings’ worth of nights, say eighteen. You also blocked six nights for your own use and for a repair. Depending on the denominator, that is either eighteen out of twenty-four, which is 75%, or eighteen out of thirty, which is 60%. Same calendar, same month, same host, fifteen points apart.
Neither is wrong. They answer different questions, and the mistake is not picking one, it is comparing a number built one way against a number built the other. If you keep both, label them, and never let the two appear in the same sentence without saying which is which.
The gap
Why your number and a market average rarely match
Search for an occupancy figure for your city and you will find several, from several companies, and they will not agree with each other or with you. That is not necessarily anyone being careless. A market data platform cannot see why a night was blocked. It sees a calendar with nights on it that were not booked, and it has to decide what to do with them.
There is a second, quieter distortion. A listing that has only been live for six weeks, or that was paused for a season, produces an occupancy figure over a short window that says almost nothing. Occupancy is a seasonal measurement pretending to be a monthly one. A single month in your low season next to a market average built over a year is a comparison that will make you change something that was not broken.
The practical version: compute your own, both ways, on a rolling twelve months, and treat the market figures as weather rather than as a score.
The trade
The number that cannot be gamed
Occupancy has one structural weakness as a target: you can always improve it by charging less. Drop the nightly rate far enough and the calendar fills, the percentage climbs, and the listing earns less than it did before. Chasing occupancy on its own is a reliable way to work harder for the same money, with more turnovers, more laundry and more wear.
You can always improve occupancy by charging less, which is exactly why it is a poor target on its own.
The repair is to multiply rather than to choose. Take your average nightly rate on booked nights, multiply by the occupancy rate, and you have revenue per available night. It moves only when you are genuinely better off. Fill the calendar by halving the price and it falls. Hold the price and lose a few nights and it can still rise.
-
1
Count booked nights, not bookings
A month of one-night stays and a month of one long stay can produce identical occupancy. Nights are the unit; reservations are not.
-
2
Decide the denominator once and write it down
Available nights or calendar nights. Pick one for internal tracking, keep the other for anyone who asks about the asset, and never mix them.
-
3
Compute average nightly rate on booked nights only
Net of platform fees if you want a number you can spend. Dividing by all nights here double-counts the occupancy you are about to multiply by.
-
4
Multiply, and track that instead
Rate times occupancy is revenue per available night. Watch it monthly and rolling twelve months, and let the occupancy percentage be a diagnostic rather than a goal.
This is spreadsheet work rather than dashboard work, because the denominators are yours to define. Our guide to the best Airbnb spreadsheet covers what the tracking side needs to hold, and how much Airbnb hosts make covers the earnings picture these figures feed.
The levers
What actually moves occupancy, in order
Three settings do more than anything else, and hosts usually reach for them in the wrong order. Minimum-night requirements come first, because a two-night minimum in a market full of one-night trips removes demand you never see as a declined enquiry. It simply does not arrive. Raising the minimum reduces turnovers and reduces occupancy at the same time, and both effects are real.
Price is second, and it is where the automated tools live. Airbnb’s Smart Pricing “uses hundreds of factors about your listing and your area to adjust your nightly price based on demand”, and the page carries two warnings worth knowing before you switch it on: weekly, monthly and trip-length discounts override it, and a discount can take the price below the minimum you set. It also overrides rule-sets, so the two cannot both be running.
Third is the calendar itself, and it is the cheapest of the three. Advance notice, preparation time between stays and how far ahead your calendar is open all remove bookable nights quietly. A host with a one-day preparation buffer has silently blocked a meaningful share of their own calendar, and it will show up in the honest denominator and never in the flattering one. Our Airbnb pricing strategy guide covers the pricing half in more depth.

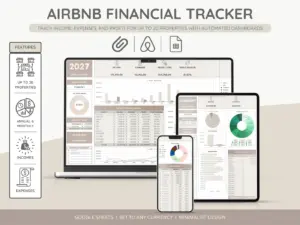

Everything you hand a guest, matched and priced to move together.
Work out both versions of your own number, write the definition next to it, and judge yourself on revenue per available night rather than on the percentage. That single change stops most of the bad decisions occupancy talk produces. Tell us in the comments which denominator you use, because hosts are split on it and the split explains most of the arguments.
FAQ
Common questions, answered briefly
How do I calculate my Airbnb occupancy rate?
Why does my occupancy rate differ from published market averages?
Is a high occupancy rate always good?
Does Smart Pricing raise occupancy?
People also ask