The job
What a Google Sheets project management template has to do
Most project spreadsheets die the same way. Someone builds a lovely file with a tab per project, a status column everyone fills in by hand, and a summary tab somebody updates on Fridays. By week three the summary says one thing, the project tabs say another, and the status column still reads “In progress” on a task that finished a fortnight ago. Nobody trusts it, so everyone goes back to asking each other.
A Google Sheets project management template survives when it is built around one rule: every task is typed once, in one list, and everything else is worked out from that list. Then it only has to answer four questions, and answer them without anyone updating a summary.
- What is late? Anything past its end date and not finished.
- What is due this week? So Monday starts with a list rather than a meeting.
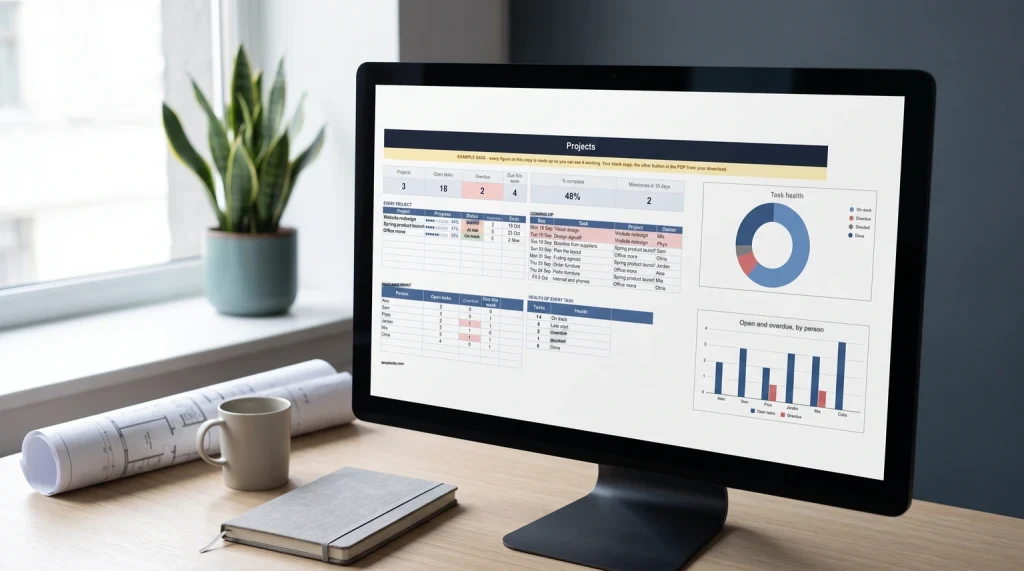
- Who has what? Open and overdue tasks per person, which is where overload shows first.
- How far along is each project? One number per project, honest about long tasks.
The task list
The task list is the only tab you type into
One row per task, all projects in the same list, with a Project column to tell them apart. Keeping several projects in one list feels messier than a tab each and is what makes the workload question answerable at all, because a person’s tasks are spread across projects.
| Column | What goes in it | Why it is there |
|---|---|---|
| A. Project | A dropdown of project names | One list, many projects |
| B. Task | A verb and an object: “Order furniture” | Something a person can finish |
| C. Owner | One name from a dropdown, never a team | A team owns nothing |
| D. Start | A real date | Late starts show up early |
| E. End | A real date | Overdue is computed from it |
| F. % done | 0% to 100%, updated by the owner | The only progress input |
| G. Health | A formula, never typed | It cannot go stale |
Column G is the one that changes how the file behaves. Instead of a status somebody remembers to change, health reads the dates and the percentage and says what is true today:
=IF(B2="","",IF(F2>=1,"Done",IF(TODAY()>E2,"Overdue",IF(AND(TODAY()>D2,F2=0),"Late start","On track"))))
Blank rows stay blank; Done at 100%; Overdue once the end date has passed; Late start if it should have begun and is still at 0%; otherwise On track.
Formula reviewed 1 November 2026
Colour column G with conditional formatting, red for Overdue and amber for Late start, and the list sorts itself visually before anyone reads a word. A task finished on time never turns red, because Done is checked first. Start, End and Owner should be dropdowns or validated dates, since one end date typed as text quietly drops that task out of every check.
The views
Three formulas that answer the Monday questions
Put these on a separate Dashboard tab. None of them is typed into, so none of them can disagree with the task list.
Due this week. =FILTER(B2:B,E2:E>=TODAY(),E2:E<=TODAY()+7,F2:F<1) lists every unfinished task ending in the next seven days. Google’s FILTER help page notes two things worth knowing: each condition “must have exactly the same length as range”, so keep every range starting at row 2, and when nothing matches it returns #N/A. A quiet week shows an error, which is good news. Wrap it as =IFERROR(FILTER(...),"Nothing due") if that bothers you.
Who has what. A short table with one row per person and two counts: =COUNTIFS(C:C,"Sam",F:F,"<1") for open tasks and =COUNTIFS(C:C,"Sam",G:G,"Overdue") for overdue ones. Swap “Sam” for a cell holding the name and copy it down. When one person has twice everyone else’s open count, that is the risk the dates have not shown yet.
How far along. Averaging % done across tasks lies, because a one-day task counts the same as a month of work. Weight by length instead: =SUMPRODUCT((A2:A="Office move")*(E2:E-D2:D+1)*F2:F)/SUMPRODUCT((A2:A="Office move")*(E2:E-D2:D+1)) gives the share of the project’s working days that are done. Blank rows add nothing to either side.
A one-day task counts the same as a month of work.
The fourth view is the timeline, and it is the same task list drawn as bars: a row of dates beside the tasks and one conditional formatting rule. Our Gantt chart template for Google Sheets walks through that grid, including the one way it fails silently.
The habit
The fifteen-minute weekly review that keeps it honest
The template is only as current as its % done column, and that column is updated by people. A short fixed review does more for accuracy than any formula.
- Owners update % done before the review, not during it. Five minutes each, on their own rows.
- Sort by health, Overdue first. Each overdue task gets one of three answers: a new end date, a new owner, or cut.
- Read the due-this-week list aloud. Anything on it that will not happen gets its date moved now, not on Friday.
- Glance at who has what. Move one task off whoever is heaviest before it becomes overdue.
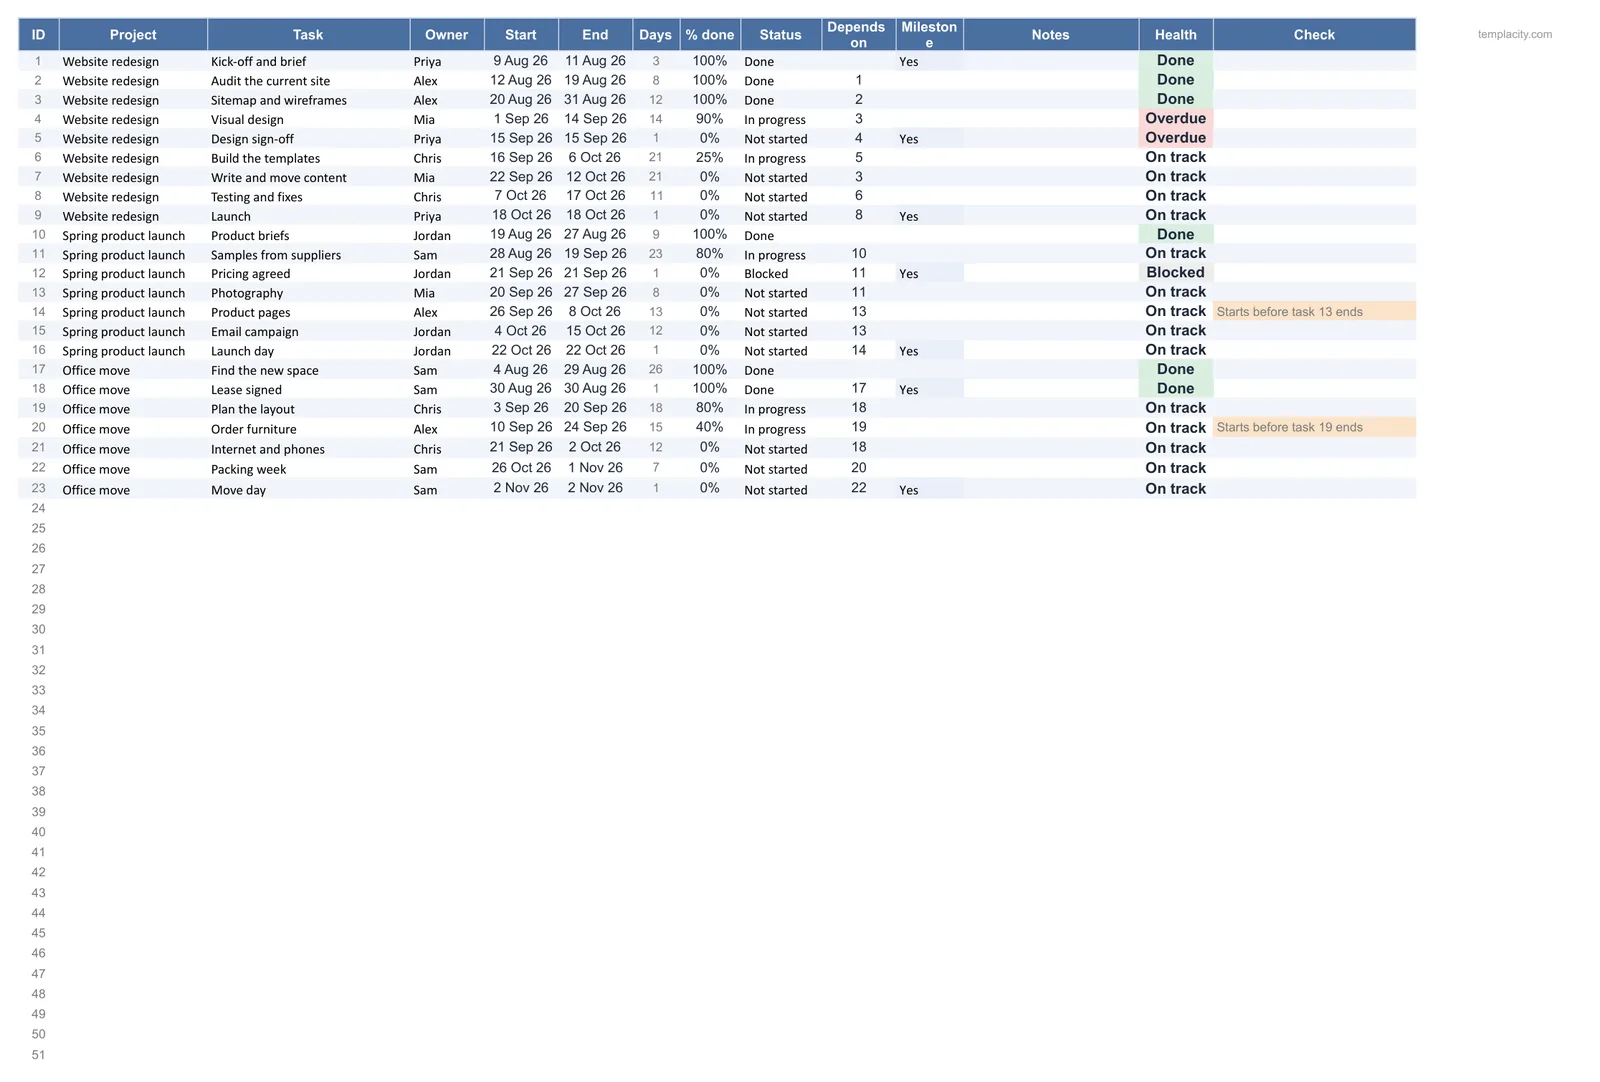
The one thing a basic sheet will not catch is a chain. If “Order furniture” slips a week, “Packing week” still sits on its old dates and still reads On track. Add a Depends on column with the task it waits for, and a check that flags any task starting before that task ends. It does not move dates for you, but it tells you which ones a slip has made impossible.
Which template
Plan, Gantt chart or tracker: which one you actually need
Searches for a project management template in Google Sheets turn up three different files under one name, and they do different jobs. Most real projects want the first and the third, with the second drawn from the third.
- A plan settles things before work starts: the goal, what is out of scope, what done means, and who approves a change. Our project plan template guide covers the eight sections.
- A Gantt chart shows when things happen. It is a view of the task list, not a separate file to maintain.
- A tracker, the subject of this page, is what you open every Monday once work is running. If the project is just you and a list, our Google Sheets to-do list template is the lighter shape.
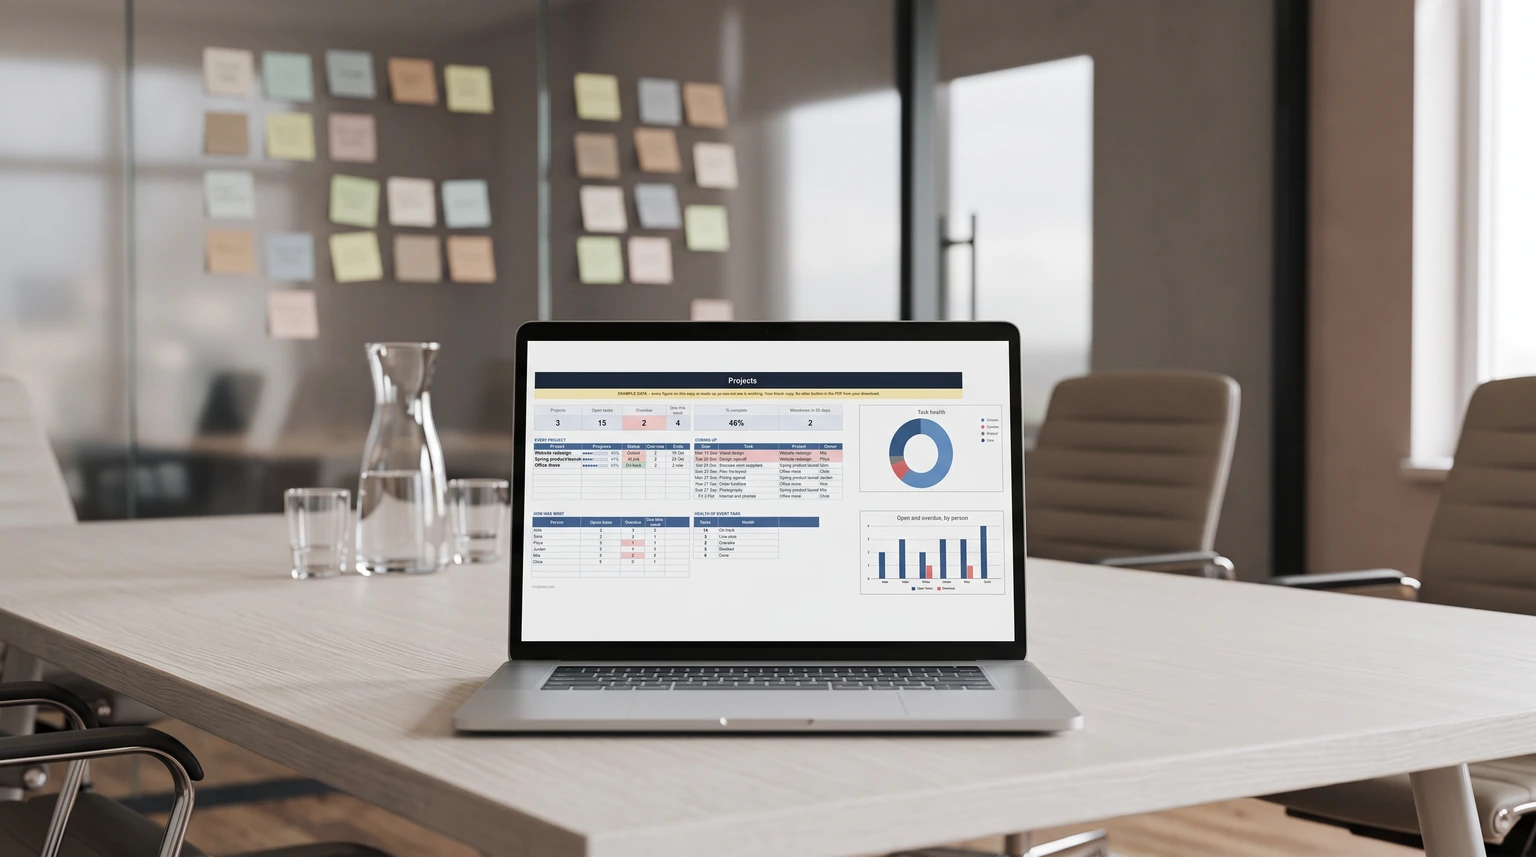
For several projects and several people at once, our Project Tracker with Gantt Chart ($39, Google Sheets and Excel) is the tracker described here, built: Tasks is the only tab you type into, health fills itself in, a Check column flags a task that starts before the one it depends on has ended, and the Gantt, a Projects tab with progress weighted by task length and a Dashboard with what is overdue, what is due this week and who has what all read from that one list. Freelancers can get it inside our Freelancer & Solopreneur Spreadsheet Kit, with a sales CRM, quotes, a to-do list and bookkeeping: all five for $129, against $195 bought one by one.
The limit
When a spreadsheet stops being enough
A spreadsheet tracker works well up to a few hundred tasks and a team that fits round one table. It strains when dates need to move themselves down a long chain of dependencies, when people outside the team need their own restricted views, or when work arrives as requests that need routing rather than as tasks someone plans. Past that point dedicated project software earns its subscription. Below it, the sheet usually wins: everyone already has it open, there is nothing to learn, and the whole project is one file you own. If your team keeps its notes in OneNote rather than Sheets, our guide to OneNote project management templates covers the same structure in a notebook, and the Google Sheets hub has the rest of the lane.
Whatever you build, make the health column a formula before you do anything else. It is the difference between a file people check and a file people update. Tell us in the comments what your Monday review actually asks, because the fourth question is rarely the same twice.
FAQ
Common questions, answered briefly
Does Google Sheets have a project management template?
How do I track multiple projects in one Google Sheet?
Should the status column be a dropdown or a formula?
What is the difference between a project plan and a project tracker?
People also ask