
What the file is for
Why hosts still pick an airbnb excel spreadsheet over a SaaS dashboard
An airbnb excel spreadsheet is the right pick when three things are true: you want the file local, you want the math visible in every cell, and you are willing to type in your bookings instead of integrating an API. That last constraint is what disqualifies most paid SaaS dashboards for a one to five unit host. The integrations cost more than the time the manual entry saves.
The other reason Excel still wins: print. A clean printed P&L for the accountant in March is something every host has needed at least once. Google Sheets prints it; Excel prints it cleaner; SaaS dashboards print a screenshot.
The five tabs
The structure: five tabs, one formula per row
Every airbnb excel spreadsheet that survives the year reduces to the same five tabs. The names change; the work does not.
Tab 1, Bookings
One row per stay. Columns: check-in, check-out, nights, property, guest first name, gross booking value, source platform (Airbnb, direct, Vrbo). Sort descending by check-in. This is the only tab where you type; every other tab pulls from it.
Tab 2, Fees
The host-fee chain Airbnb takes (the 15 percent or 3 percent depending on your jurisdiction), cleaning fee paid to the cleaner, occupancy or transient lodging tax, and any platform-side adjustments. The output column is one number: fees out per stay. Reference the Bookings tab with a VLOOKUP or XLOOKUP on the stay ID.
Tab 3, Expenses
Categorised by IRS Schedule E line items (or your country’s equivalent): supplies, utilities, repairs, depreciation, insurance, professional fees. Date, vendor, amount, property, category. Tax-category alignment is the one place we recommend not deviating from the published categories. Your accountant will roll these into the return as-is.
Tab 4, P&L
Monthly grid. Rows = revenue, fees, expenses by category, host net. Columns = months. Formulas sum the Bookings and Expenses tabs by month using SUMIFS. A property selector at the top filters the whole sheet to one unit at a time, which is the trick most free templates miss.
Tab 5, Per-property
One row per property. Columns: address, beds, ADR, occupancy rate, gross revenue YTD, host net YTD, cost per stay. This is the tab you screenshot when the bank asks for a unit-economics view. Build it once; the formulas keep it current.
An airbnb excel spreadsheet wins on print and predictability. It loses the second you share it across two devices.
Formulas that matter
The four formulas your airbnb excel spreadsheet actually needs
Templates fail because they pack in twelve cross-tab lookups and break the second a row gets inserted. The working build leans on four formulas, used consistently.
| Formula | Where | Job |
|---|---|---|
| XLOOKUP | Fees tab | Pull gross booking value from Bookings into Fees by stay ID |
| SUMIFS | P&L tab | Sum bookings or expenses by month and property |
| IFERROR | Everywhere | Trap blanks so the P&L doesn’t show #N/A across empty months |
| EOMONTH | Bookings tab | Tag each stay with its month-end date so SUMIFS works without manual columns |
Where Excel wins, where it loses
Excel vs Google Sheets vs SaaS: the honest split
| Setup | Wins on | Loses on |
|---|---|---|
| Excel (desktop) | Print quality, formula predictability, offline access, file ownership | Cross-device sharing, co-host collaboration, mobile entry |
| Google Sheets | Real-time sharing, mobile entry, automatic backup, free | Print formatting, formula speed at scale |
| SaaS dashboard (Hostfully, Beyond, etc.) | Auto-imports bookings, multi-platform sync, pricing tools | Cost ($30-200/month), lock-in, opacity (you can’t see the formula) |
For one to five units: Excel or Google Sheets. For six to twenty: still Sheets, usually, because the sharing matters more than the print. Above twenty units, the SaaS math starts working out. The same offline-versus-browser trade-off decides a household budget, and our Excel budget template walks through the one Excel feature that keeps either kind of workbook counting past row sixty.


Everything you hand a guest, matched and priced to move together.
Where to start
Starting points: free files, paid templates, and DIY
Start here, because it is free and it is already built: our Airbnb host tracker workbook is a direct download, no email and no account, with the bookings, expenses and per-month summaries wired up, and the other three sit on our free Excel templates page. If you would rather build your own, three honest paths:
- Free DIY: open a blank workbook, build the five tabs above. Two evenings of focused work. The advantage is you understand every cell because you wrote it.
- Free templates on Reddit / r/AirBnB: usable starting points, often missing the per-property selector or the fee chain. Plan to spend two hours fixing them.
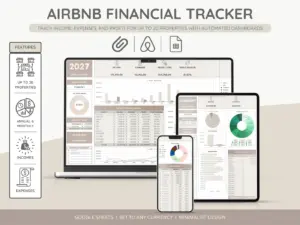
- Paid templates (including our own Airbnb spreadsheet): $20-50, locks in the structure, three colour variants, host-tax categories baked in. Worth it when you’d rather spend the two hours on your listing copy.
If you would rather not build it, the host spreadsheet ships assembled inside the Airbnb Superhost Bundle, alongside the welcome book and the printable signs, and it already runs the five-tab structure above with the per-property selector pre-wired.
The honest test for any starting file: open it, type one stay, and see if you can read the host-net number in under thirty seconds. If yes, keep it. If no, the file is decoration.
If you’re running this for the first time and want a second pair of eyes on the structure, we’re happy to look. The host community gets sharper when the spreadsheets get sharper.
Prefer Sheets to Excel? Our Airbnb Google Sheets template is the same workbook, cloud-native.
FAQ
Common questions, answered briefly
Is Excel or Google Sheets better for tracking Airbnb income?
What columns should an airbnb excel spreadsheet have?
How do you calculate host net per stay in Excel?
Can one airbnb excel spreadsheet handle multiple properties?
How long does it take to build an airbnb excel spreadsheet from scratch?
If yours isn’t above, drop the question in the comments and we’ll fold it into the next update.
People also ask