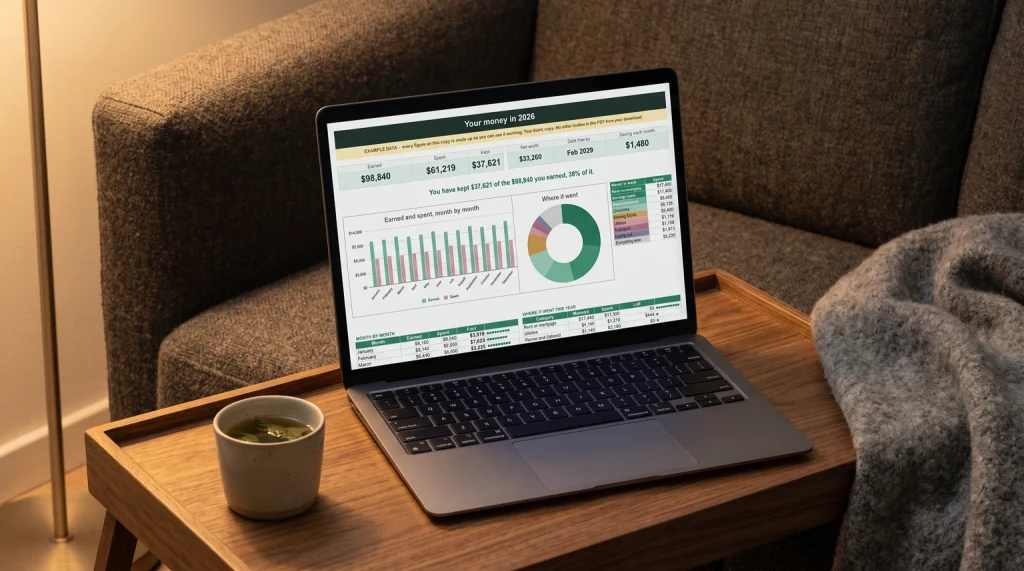
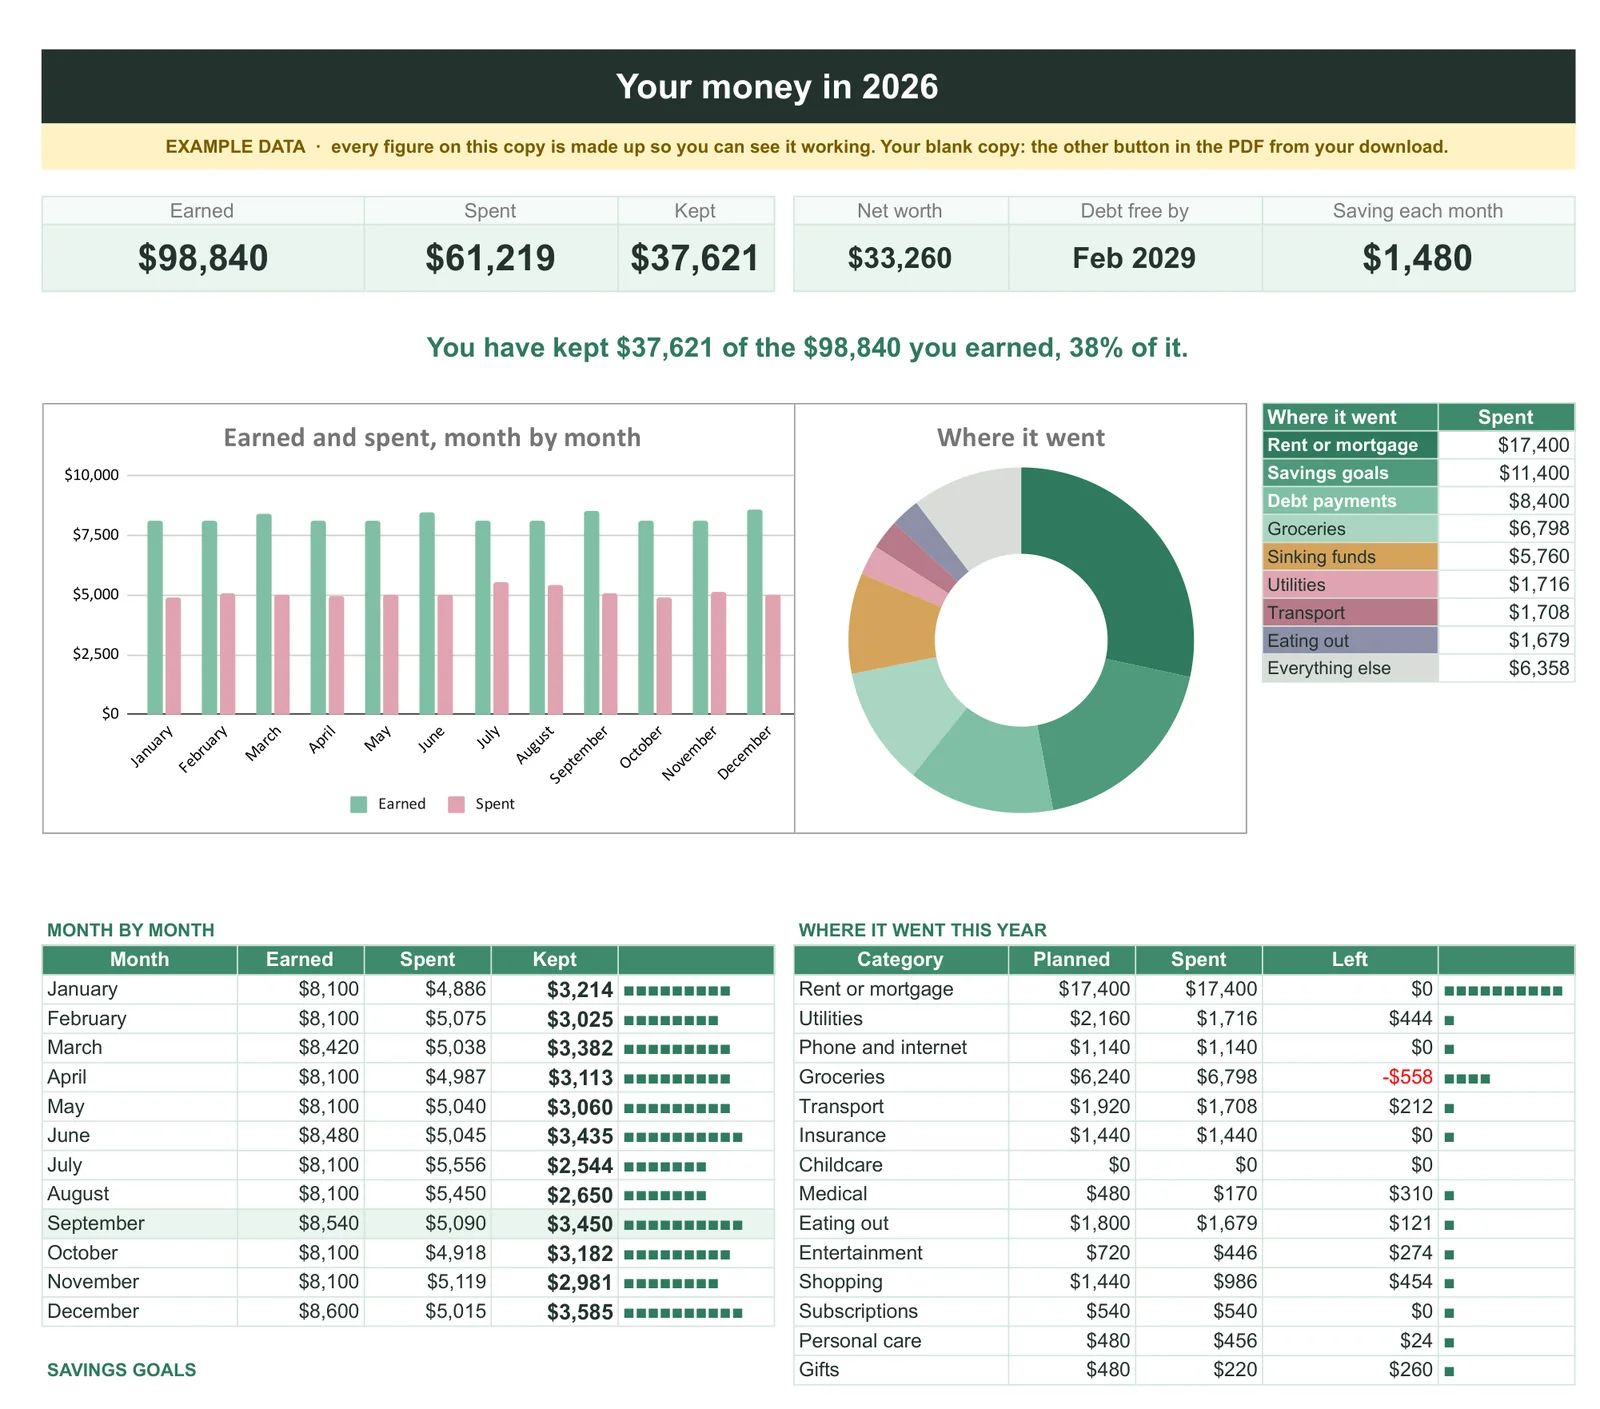
The example above is one month. Our Budget & Money Planner ($39, Google Sheets and Excel) shows what a filled-in year looks like: on its example data the year page reads “You have kept $37,621 of the $98,840 you earned, 38% of it,” above a month-by-month table and a breakdown of where the money went. Bills, debt payoff, sinking funds, savings goals and net worth sit in the same file.
The shape
What a filled-in excel budget spreadsheet example looks like
Screenshots of empty budget templates are everywhere and they teach you nothing, because an empty budget is just a grid. What people actually want when they go looking for a worked file is to see where the numbers go, how many rows there really are, and what the thing looks like halfway through a month rather than on the day it was made.
Any budget file worth keeping has four parts, and no more than four. Everything else on a busy-looking template is decoration sitting on top of these.
| Part | What is in it | How big it gets |
|---|---|---|
| The plan | One row per category with the money you intend it to take this month. This is also the only place the category names are written down. | Ours ships with twenty-one so you delete rather than invent. Most people settle around ten, and it barely changes month to month after that. |
| The log | One row per transaction: date, category, amount, and the account it came from. Nothing else. | Sixty to two hundred rows a month, which is why the row-limit question decides whether the file survives. |
| The summary | Planned against actual, one line per category, with the difference. Reads the log, never typed into. | The same rows as the plan, generated rather than written, with a difference column beside them. |
| The settings | The month you are looking at, the category list the dropdowns read, and anything else the formulas need. | A handful of cells, and the tab most templates leave out, which is why their category lists live in nine places. |
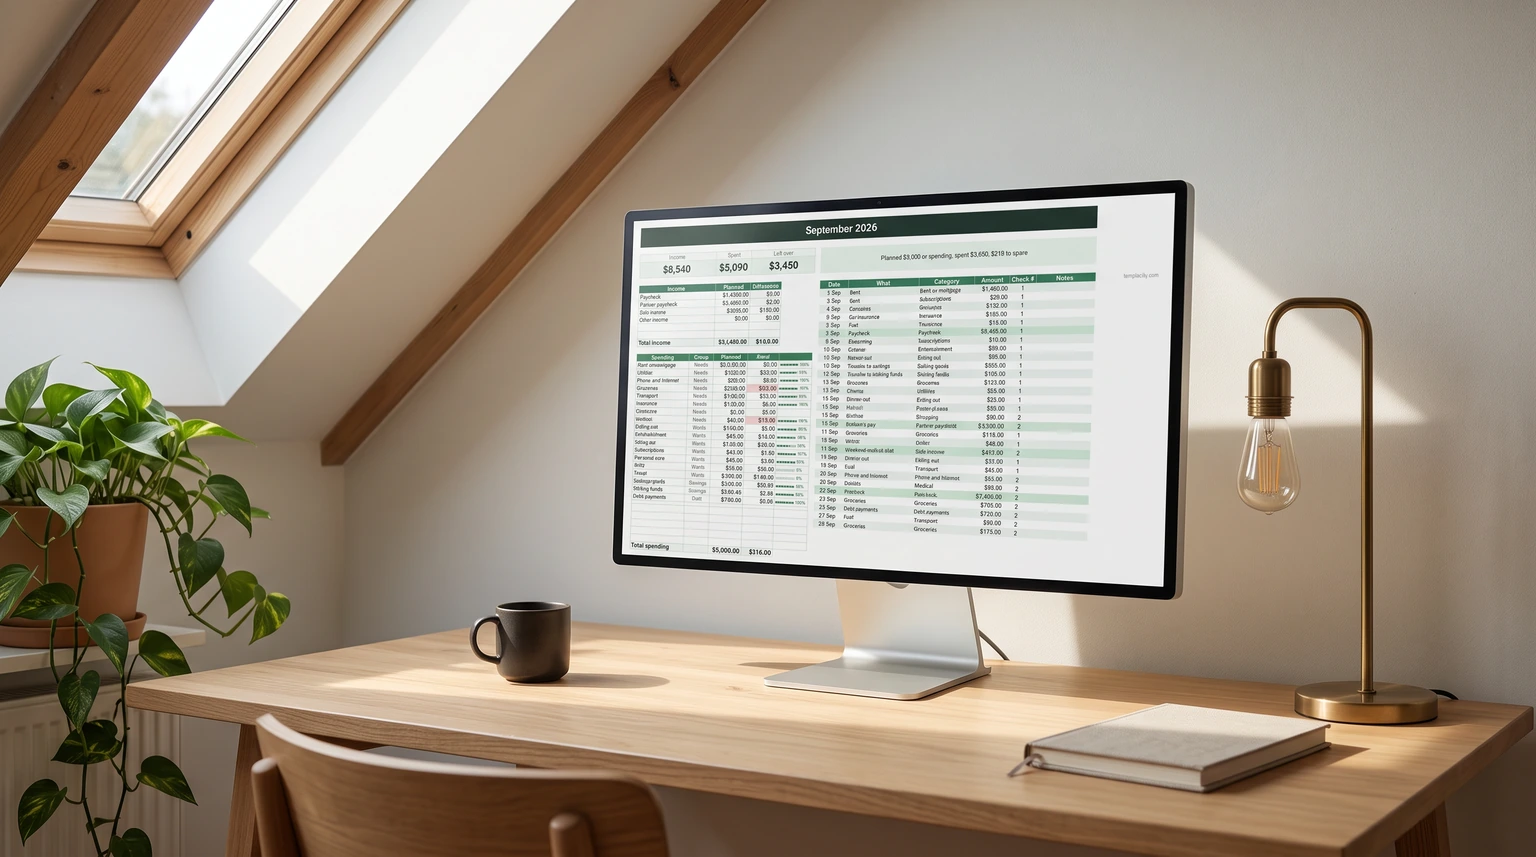
Filled in, the summary is the part you look at. Below are the first nineteen of its twenty-one rows, read straight off our own file: a September on 3,520 dollars in, against 3,150 planned. To be explicit, because it matters: this is example data written to demonstrate the workbook. It is not an average, not a survey and not advice about what anyone should spend.
| Category | Planned | Actual | Difference |
|---|---|---|---|
| Salary | 3,200.00 | 3,200.00 | 0.00 |
| Side work | 250.00 | 320.00 | 70.00 |
| Rent or mortgage | 1,150.00 | 1,150.00 | 0.00 |
| Groceries | 420.00 | 380.45 | 39.55 |
| Electricity | 85.00 | 82.15 | 2.85 |
| Water | 30.00 | 0.00 | 30.00 |
| Internet | 45.00 | 45.00 | 0.00 |
| Phone | 35.00 | 32.00 | 3.00 |
| Transport | 120.00 | 58.00 | 62.00 |
| Insurance | 95.00 | 95.00 | 0.00 |
| Health | 60.00 | 18.60 | 41.40 |
| Eating out | 140.00 | 54.80 | 85.20 |
| Coffee | 45.00 | 19.10 | 25.90 |
| Subscriptions | 25.00 | 12.99 | 12.01 |
| Clothes | 70.00 | 78.00 | -8.00 |
| Hobbies | 60.00 | 0.00 | 60.00 |
| Gifts | 40.00 | 35.00 | 5.00 |
| Travel fund | 100.00 | 0.00 | 100.00 |
| Emergency fund | 250.00 | 250.00 | 0.00 |
Three things in that table are the whole point. The emergency fund and the travel fund sit in the category list with planned amounts against them, rather than turning up at the bottom as whatever survived. Exactly one row is over, Clothes by eight dollars, which is what a real month looks like. And three rows sit at zero on the actual side, Water, Hobbies and the travel fund, because bills land on their own schedule and not every category fires every month. A worked example where every row lands exactly on its number is a diagram, not a budget.
Above that table the file carries six headline figures, and they are the ones to read first: 3,520 in, 2,511.09 out, 3,150 planned to spend, 450 put aside, 638.91 left of the plan, and 1,008.91 of in minus out. The gap between the last two is the useful part. “Left of the plan” says how the month is going against the intention, “in minus out” says what actually accumulated, and a month where those two disagree sharply is a month where the plan needs changing rather than the spending.
Scale
The same budget at three different incomes
This is the part a single screenshot cannot show, and it is the reason most people bounce off examples: the file they are looking at was built for someone whose money does not resemble theirs. The structure does not change with income. The proportions do, and so does which category is the one that hurts.
| Income after tax | What the plan looks like | The category that decides the month |
|---|---|---|
| Tight | Fixed costs take most of it. Savings and the annual pot are small but present, because a small line that always gets funded beats a large one that never does. | Groceries. It is the only large flexible cost, so it absorbs every surprise, and it is where a budget either helps or becomes a source of guilt. |
| Comfortable | Fixed costs settle into roughly half, the set-aside group becomes meaningful, and the flexible categories finally have room to be planned rather than rationed. | Eating out and going out. It is elastic, it is invisible in the moment, and it is where the difference between a good month and a bad one usually lives. |
| Higher | Fixed costs shrink as a share, and the set-aside group is the largest block in the plan. The file starts being about direction rather than survival. | Whatever is not in the file at all. At this level the leaks are one-off and large, so the annual pot and an explicit category for irregular spending do the work. |
A worked example where every row lands exactly on its number is a diagram, not a budget.
Reading it
Telling a good month from a bad one at a glance
A summary like the one above is only useful if you can read it in about five seconds on the way past. Three signals do almost all the work, and none of them is the bottom line.
- Did the set-aside rows get funded? Savings and the annual pot are the two that quietly get skipped, and skipping them is what makes a month look fine while making next year worse. If they are at zero and everything else is green, it was not a good month.
- Is one flexible category doing all the overspending? One category over by a lot is a specific, fixable thing. Every category over by a little usually means the plan is wrong rather than the spending, and the plan is the easier of the two to change.
- Is the log still being filled in? A budget with fourteen entries on the 25th of the month is not telling you that you spent nothing. It is telling you it stopped being maintained around the 10th, and every number under it is fiction.
The third one is the most common failure by a wide margin, and it is worth checking before you conclude anything at all from a summary. It is also the reason the log tab should be as boring as possible: four columns, dropdowns on the category, and nothing you have to think about at the till.
The gaps
The rows an example never shows you
Published examples are tidy because a tidy screenshot is what gets shared. Three rows that belong in a real file almost never appear in one.
The first is the correction. You will categorise something wrongly, notice three weeks later, and need to fix it without hunting for the original row. A file that lets you type a small offsetting entry with a note in it is a file you will keep using; a file that demands archaeology is one you will stop opening.
The second is the transfer between your own accounts. Moving money from current to savings is not spending, and a workbook that counts it as an expense will tell you that you overspent by exactly the amount you saved. Either give transfers their own category and exclude it from the sums, or leave them out of the log entirely and let the savings row in the plan be the record.
The third is the reimbursement, which behaves the same way in reverse: you pay for something and get the money back later, and it lands in a different month from the expense. Log it as a negative amount in the same category rather than as income, so the category tells the truth even though the month does not.
All three are easy in a single-log workbook and awkward in one with twelve monthly tabs, which is the structural argument made in full on our monthly budget page. They come down to the same mechanism: a summary written with SUMIFS, which Microsoft describes as adding “all of its arguments that meet multiple criteria”, does not care whether an amount is positive, negative or sitting in an excluded category. It just answers the question you asked it.
The file
The free workbook this example comes from
Every number on this page came out of the file below. It ships with three months of example transactions and a filled plan, so the dashboard shows something on first open rather than a screen of zeroes. The plan tab arrives with twenty-one categories on purpose: deleting a row you do not need takes a second and remembering one you forgot takes a month. Both the example rows and the spare categories are meant to be deleted, and the sooner the better: an example is worth about a week, after which your own first fortnight of real entries teaches you more than any published one can.
One note on how it is built. The Transactions log is a real Excel Table, so new entries join it as you type: as Microsoft puts it, “to add a row at the bottom of the table, start typing in a cell below the last table row. The table expands to include the new row.” The totals use whole-column ranges as well, so nothing stops counting when the log gets long.
Opening it costs nothing either way. Microsoft states that you get free access to Word, Excel and PowerPoint through Microsoft 365 for the web with a free account and 5 GB of storage. From here, the Excel budget template page covers the platform question, the personal budget cut covers what to strip out if you are budgeting alone, and making a budget in Excel builds the whole thing from an empty sheet if you would rather not start from anyone’s file.
FAQ
Common questions, answered briefly
What should a budget spreadsheet actually contain?
Should I copy the numbers from a budget example?
How do I record moving money into savings?
Why does my budget look fine when it is not?
People also ask
Other questions, briefly answered
If your version of this ends up better than ours, we would like to see it. The rest of our spreadsheet work, free files included, sits on the spreadsheets hub, and a fair share of what is in those files started as a reader’s fix rather than our idea.