Three numbers
What a rental property spreadsheet has to answer
A rental property spreadsheet usually gets asked three different questions at once. Is this a good property? Will it put money in my pocket? And what will it do to my taxes? Each question has its own number, and most of the confusion around rental analysis comes from reading one of them as if it answered another.
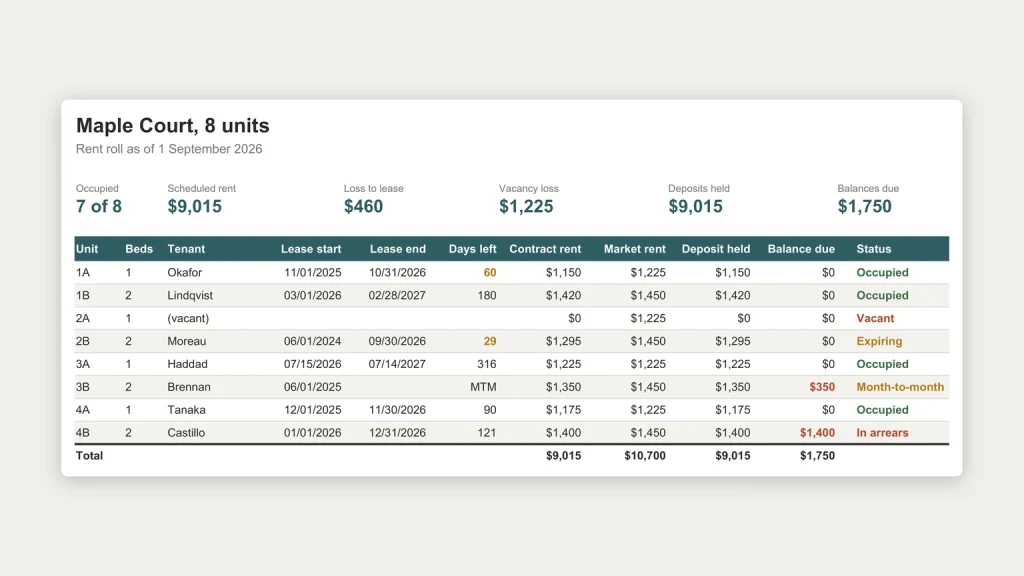
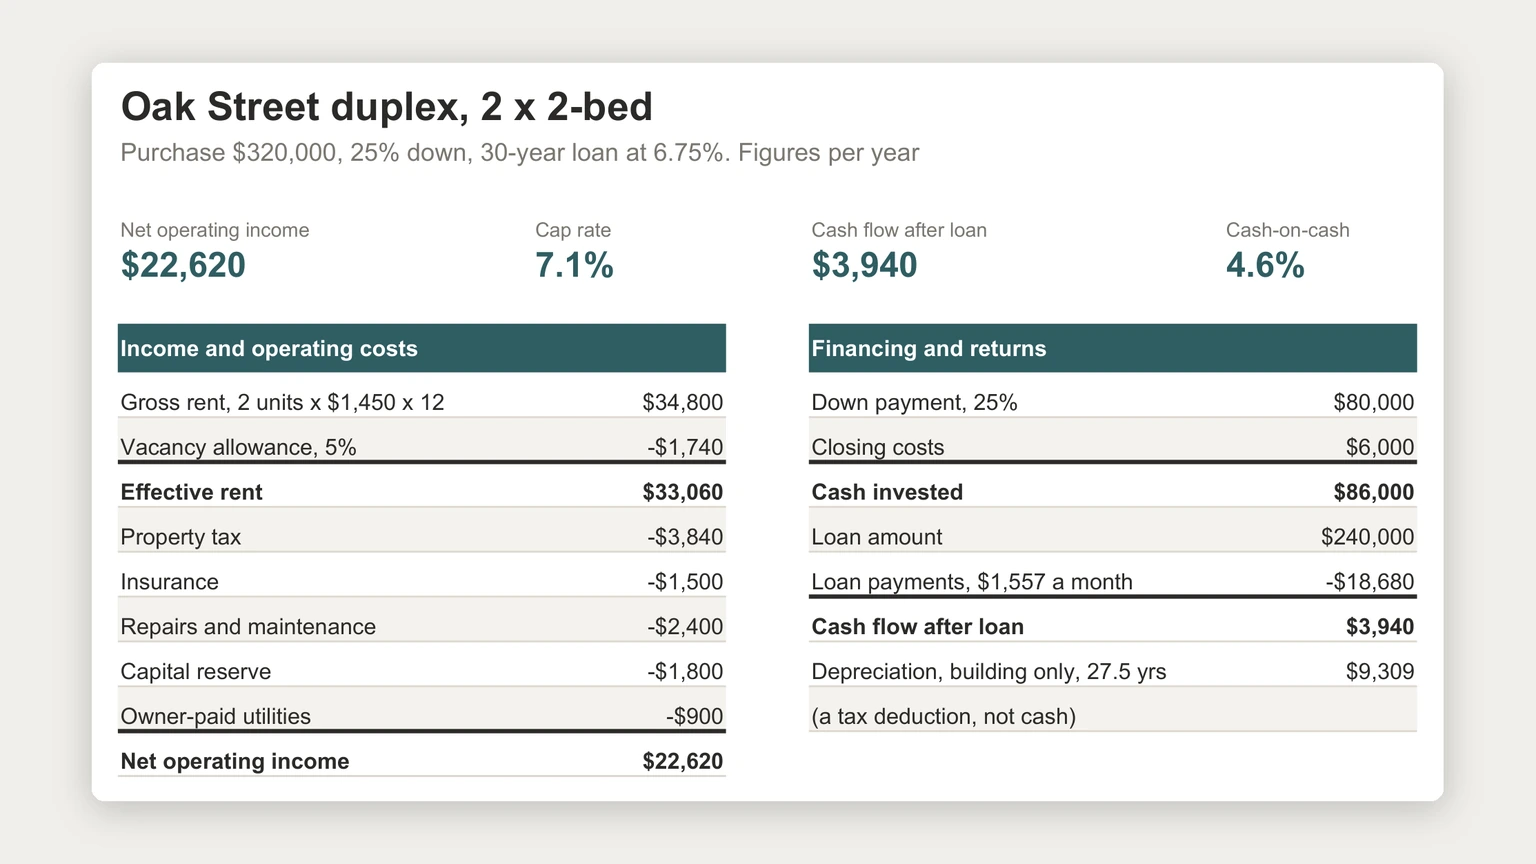
The example at the top of this page is a fictional duplex bought for $320,000 with 25 percent down. We use it all the way through so every figure can be checked against the sheet. If you manage more than one unit, the rent roll template guide covers the unit-by-unit view this analysis starts from.
The property
Net operating income: what the property earns
Start with the rent the units could bring in over a year: two units at $1,450 a month is $34,800. Take off an allowance for vacancy, because no property is let every day of every year; at 5 percent that is $1,740, leaving $33,060 of effective rent.
Then subtract the costs of running the building: property tax, insurance, repairs, any utilities the owner pays, and a reserve for the big items like a roof or a boiler that arrive every few years. In the example these come to $10,440. What is left, $22,620, is net operating income.
Notice what is not in that list: the mortgage. Net operating income describes the property, not the way you paid for it, so two buyers with different loans get the same figure. That is what makes it the right number for comparing one building with another.
Cap rate
Cap rate, and what it can and cannot tell you
Divide net operating income by the price and you have the cap rate: $22,620 over $320,000, about 7.1 percent. It is a way of saying what the property would return if you bought it with cash, and it is useful for comparing buildings at different prices.
What it cannot tell you is what you will actually receive once any mortgage is paid. A cap rate is only as honest as the operating costs behind it, too: leave out the reserve or the vacancy allowance and the rate jumps, which is exactly how listings end up quoting numbers the buyer never sees.
Your pocket
Cash flow after the loan: what reaches you
If the purchase is financed, the loan payments come out next. The example assumes a $240,000 mortgage over 30 years at 6.75 percent, which works out at about $1,557 a month, or $18,680 a year. Subtract that from net operating income and the owner is left with $3,940 a year, against the full $22,620 a cash buyer would keep. That gap is the cost of the loan, and it is worth seeing in black and white before deciding to borrow. The same property that returns 7.1 percent on its price returns $3,940 on the $86,000 of cash actually put in, the down payment plus closing costs. That is a cash-on-cash return of 4.6 percent.
The same property that returns 7.1 percent on its price returns $3,940 on the $86,000 of cash actually put in.
Work out the payment with Excel’s PMT function, which Microsoft describes as calculating “the payment for a loan based on constant payments and a constant interest rate”. Mind the units: for monthly payments, Microsoft’s own example divides the annual rate by 12 and multiplies the years by 12. Our amortization schedule in Excel guide shows the full payment table if you want to see how much of each payment is interest.
One caveat keeps this number honest. Part of every loan payment repays principal, which you get back as equity when you sell. So cash flow after the loan understates the property’s return, and cash-on-cash is a measure of spending money rather than of the whole return.
Taxes
Depreciation: real on the tax return, not in the bank
The IRS lets you deduct the cost of a rental building over time. Its Publication 527 explains that “you recover the cost of income-producing property through yearly tax deductions”, lists a 27.5-year recovery period for residential rental property under the general depreciation system, and states that “you can’t depreciate the cost of land because land generally doesn’t wear out, become obsolete, or get used up.”
So the sheet splits the price into land and building first. Assuming $64,000 of the example’s price is land, the building’s $256,000 over 27.5 years gives $9,309 a year. That figure matters for the tax return, and it is why a property with positive cash flow can show a much smaller taxable profit. But it is not money arriving or leaving, so it sits on its own line and is never added to cash flow.
Keeping it current
From purchase analysis to a sheet you run the property on
Most people build this sheet once, before buying, and never open it again. It is more useful the other way round. Keep the same layout, add an actual column next to each estimate, and fill it from the year’s real rent and bills. Within a year you will know whether your vacancy and repair assumptions were right, which is the knowledge that makes the next purchase analysis trustworthy.
For timing within the year, when the insurance renews or the property tax falls due, the cash flow forecast template guide shows how to lay costs out by the month they are paid. Everything else we have written for landlords and agents is on the real estate hub.
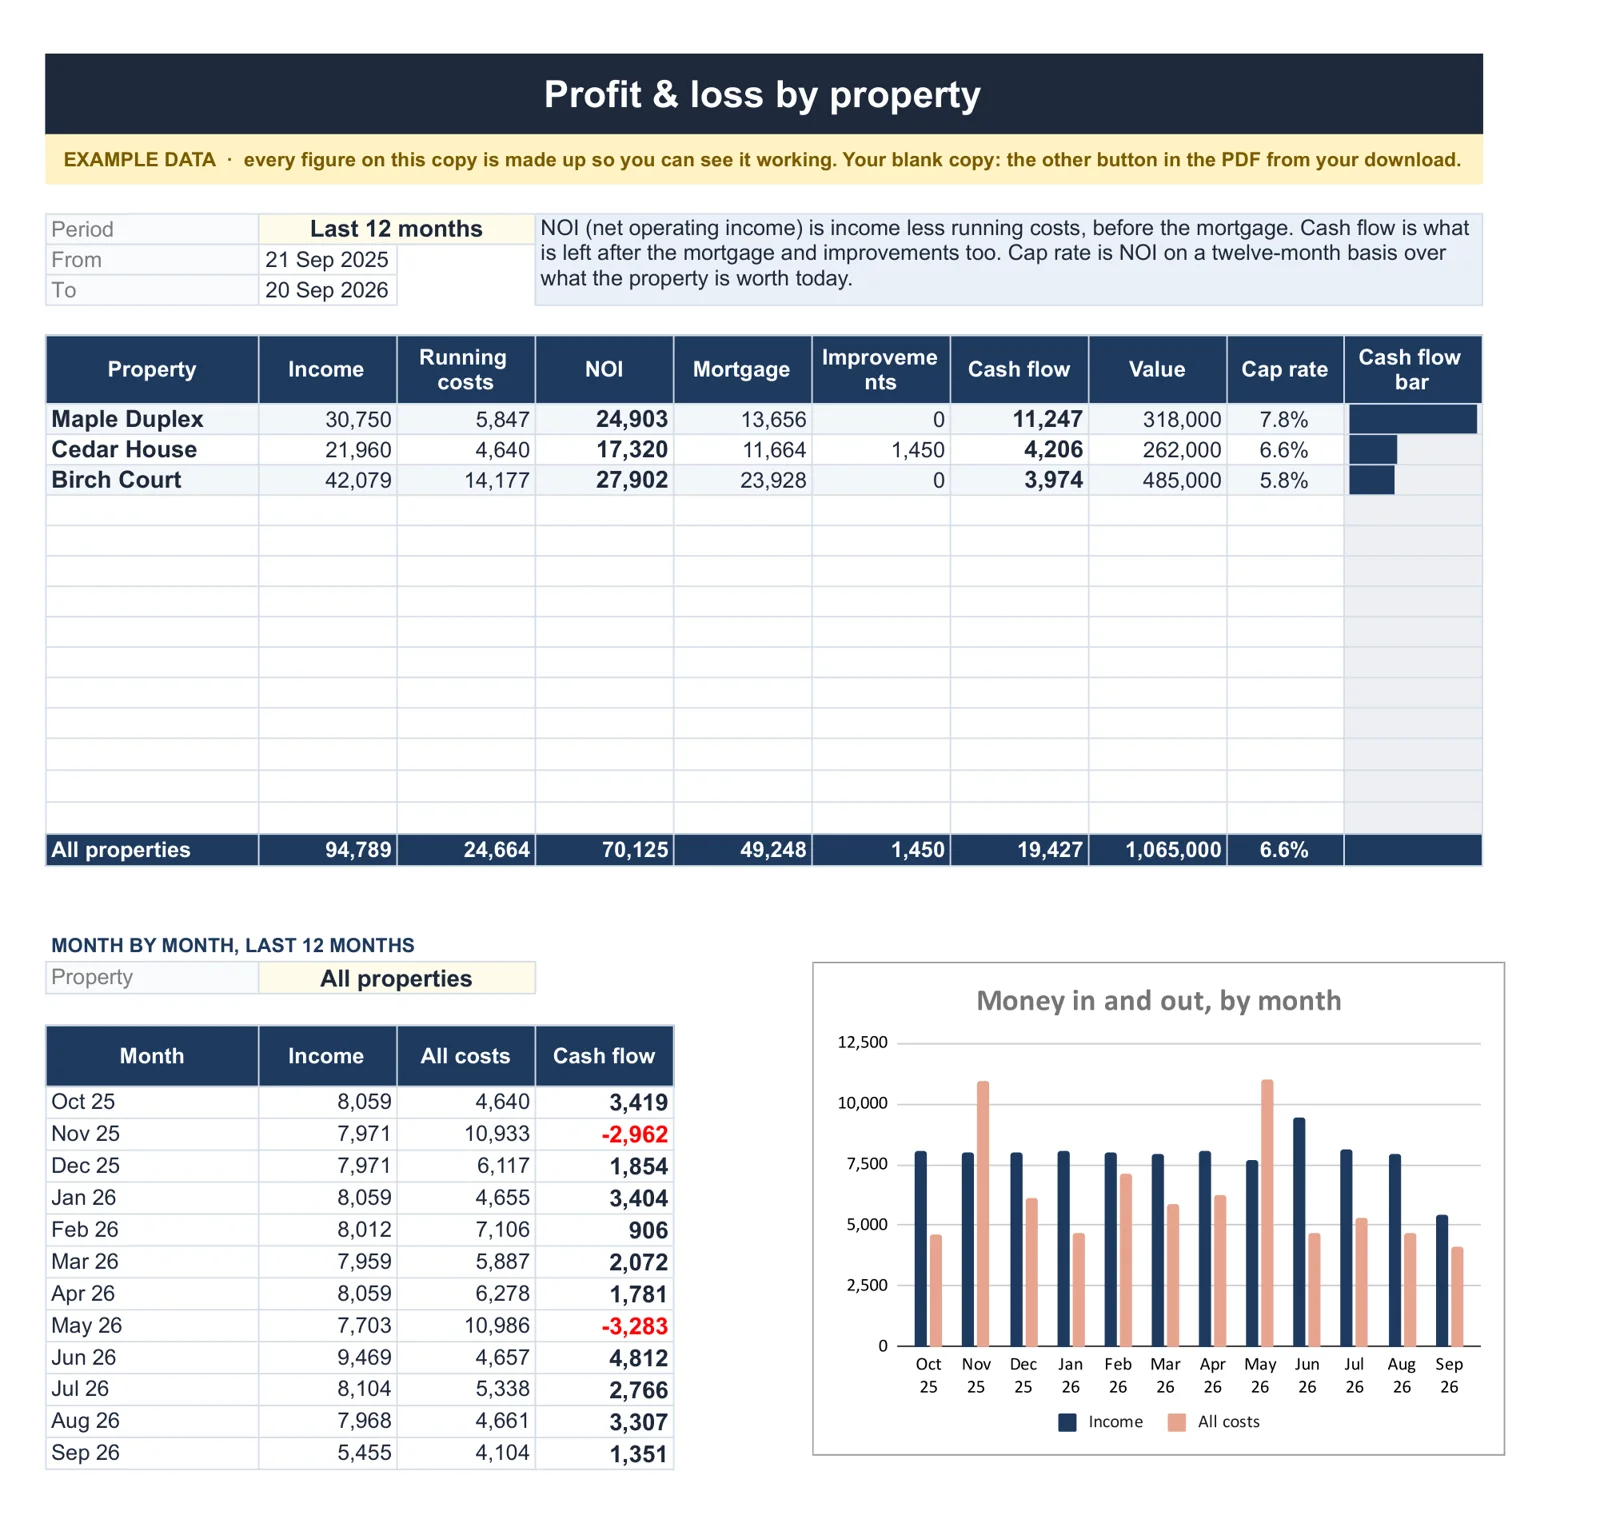
If you would rather start from a finished file, our Landlord & Rental Property Manager ($59, Google Sheets and Excel) works out each property’s profit and loss for any period, with NOI, cash flow and cap rate, from rent and costs logged as they happen. A rent tracker colours every unit paid, part paid or unpaid across twelve months, and a What If tab says how far the rent can fall before the year turns red.
A rental property spreadsheet that keeps these three numbers apart will talk you out of some deals and into better ones. Tell us in the comments which assumption surprised you most once you owned a property, vacancy, repairs or something else; we read every reply.
FAQ
Common questions, answered briefly
What should a rental property spreadsheet include?
What is the difference between NOI and cash flow?
How do you calculate cap rate and cash-on-cash return?
Is depreciation part of rental cash flow?
People also ask