The point
Track profit per item, not sales
Most resellers know their sales number, because every platform shows it on the home screen. Almost none of them show what you kept. The gap between the two is fees, shipping labels, supplies and the price you paid at the thrift store, and it is different for every item, every category and every platform. A reselling spreadsheet exists to close that gap one row at a time.
It also answers the question sales never can: what is sitting on the shelf. Stock you bought and have not sold is cash you already spent. A sheet that records the day you bought each item can tell you, every morning, which pieces are going stale and need a lower price or a different platform.
Columns
The columns a reselling spreadsheet needs
One row per item, from the day you buy it. Each column below answers a question you will actually ask later; anything that answers nothing is a column you will stop filling in.
| Column | What it answers later |
|---|---|
| SKU and item | Which bin it is in, and what it is when a buyer messages |
| Category and source | Which categories and which sources (garage sale, thrift, estate, auction) pay best |
| Bought date and cost | How long your cash has been tied up, and in what |
| Listed date, platform, list price | How long it took you to list, and where it sits now |
| Sold date and sale price | What it really went for, which is rarely the list price |
| Shipping charged and shipping cost | Whether shipping made or lost you money on this sale |
| Fees and other costs | What the platform and your supplies took |
| Profit, return, days | The three numbers that decide what you buy next |
Make the category, source, platform and status columns dropdowns so the same thing is always spelled the same way. “FB Marketplace” in one row and “Facebook” in another will split your platform numbers in two.
A worked sale
Fees and shipping: one eBay sale, worked through
Take one fictional pair of Dr. Martens boots, bought at a garage sale for $19 and sold on eBay for $85, with the buyer paying $5.99 for shipping. eBay’s own fee page sets the final value fee for most categories at 13.6% of the sale, counts the shipping the buyer paid as part of the sale, plus $0.40 per order over $10.
| Line | Amount |
|---|---|
| Sale price | $85.00 |
| Shipping the buyer paid | + $5.99 |
| eBay fee: 13.6% of $90.99, plus $0.40 | − $12.77 |
| Shipping label you bought | − $9.62 |
| What you paid for the boots | − $19.00 |
| Profit | $49.60 |
| Return on what you paid | 261% |
The quick sum, $85 less $19, says $66. The real figure is $49.60, so a quarter of the apparent profit went to the fee and the label. eBay also counts any sales tax the buyer pays as part of the sale, so in a state with 7% tax the fee rises by another 87 cents and the profit falls to $48.73. Every platform publishes its own fee page and they all work differently, which is why the fee belongs in a column of its own rather than in your head.
Time
Days to sell, and the stale line
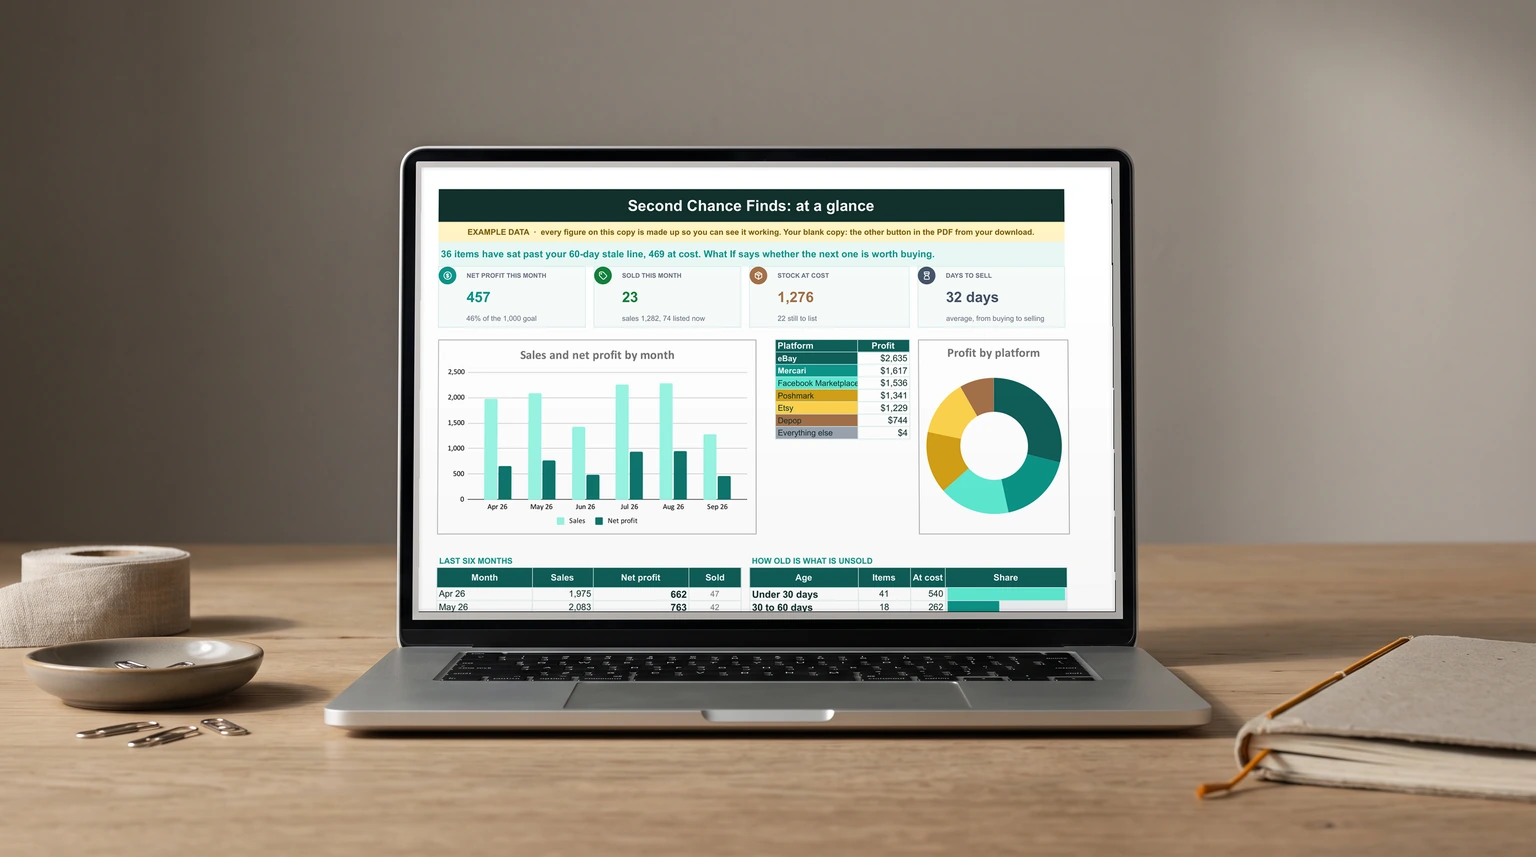
Add a days column: sold date minus bought date for sold items, today minus bought date for everything else. Averaged over what sold, it is your real turnaround. In our product’s example data, a made-up shop with 96 items on hand, it is 32 days from buying to selling.
Then pick a stale line, the age after which an item gets repriced, cross-listed or pulled. Grouping unsold stock by age shows where the cash is stuck. In the same example, 41 items worth $540 at cost are under 30 days old and doing fine. Past 90 days sit 23 items holding $330, and six of them are over 180 days. Those rows are the week’s work, not the next haul.
Stock you bought and have not sold is cash you already spent.
Where it pays
Which platform and category actually pay
Once every sold row carries a profit, a small summary table does the rest. One SUMIFS per platform adds the profit column where the platform matches and the status is sold; Google describes SUMIFS as the function that “returns the sum of a range depending on multiple criteria”. The same formula by category, and by source, tells you where to shop.
Rank by profit, not by sales. A platform with lower fees can pay more on the same item even at a lower price, and a category that sells fast at a thin margin can be worth less than one that sells slowly at three times the return. If you run the reselling as a business, those monthly sums are also the income lines of a profit and loss template, and supplies such as mailers and tape belong in an expense tracker, not buried in one item’s row.
Before you buy
The most you can pay for the next item
The best use of the sheet is standing in the thrift store. Take what that category usually sells for, less the fee and the label, and divide by one plus the return you want. For the boots, $90.99 of sale and shipping less $12.77 of fee and $9.62 of label leaves $68.60. At a 100% return, the most you should pay is $34.30; at $19 they were an easy buy.
Your own sold rows supply the typical price per category, so the answer gets better the longer you keep the sheet. The same log also works for stock you hold in bulk; our Google Sheets inventory template guide covers counting stock by movements rather than overwriting a quantity.
Keeping it current
Keeping a reselling spreadsheet current
Log the item the day you buy it, while the receipt is in your pocket, and fill the sale columns the day it sells. Two short updates per item is sustainable; reconstructing a month of sales from platform emails is not. More sheets in the same spirit are on our Google Sheets hub.
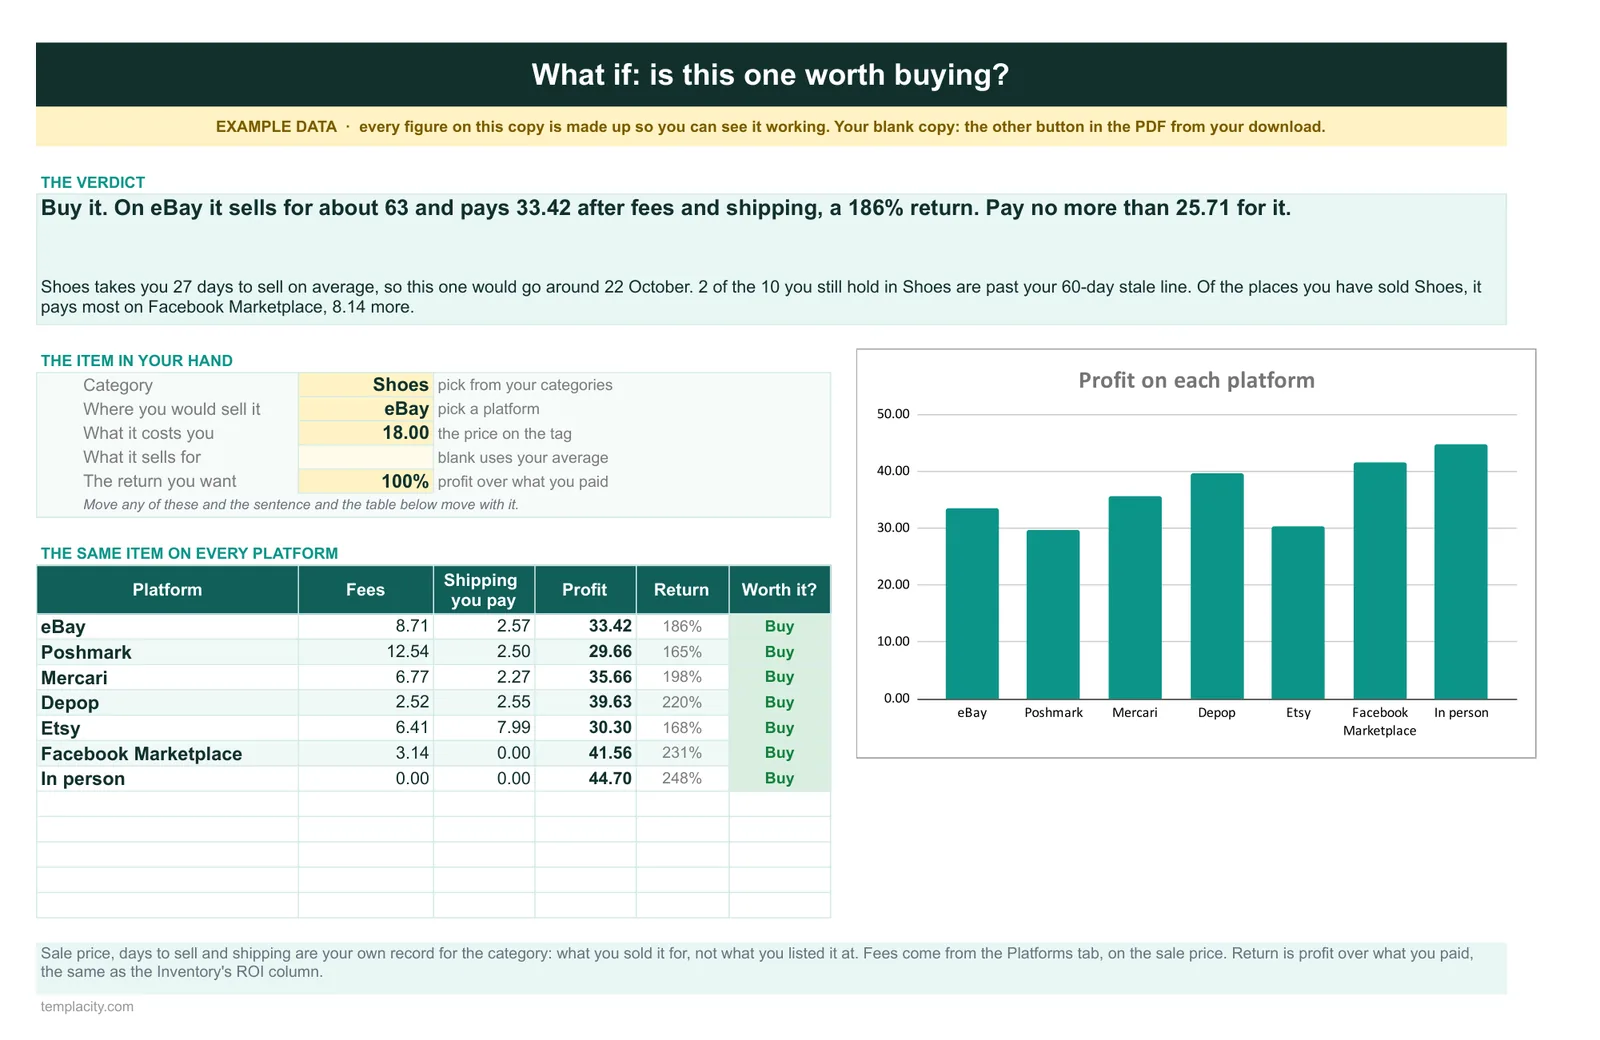
If you would rather start from a finished file, our Reseller Inventory & Profit Tracker ($39, Google Sheets and Excel) does the arithmetic above for every row, with a dashboard of profit by month and by platform, and the age of what is still unsold. Its What If tab takes the item in your hand, its category, the platform and the price on the tag, and says whether to buy it and the most to pay for the return you want.
A reselling spreadsheet that nets out the fee and dates every item turns a pile of sales into a clear answer on what to buy next. Tell us in the comments which platform pays you best once fees are out, and where you draw your stale line; we read every reply.
FAQ
Common questions, answered briefly
What should a reselling spreadsheet track?
How do you calculate reselling profit?
Does eBay charge its fee on shipping?
When is reselling inventory stale?
People also ask