The gap
Pipeline is not a forecast
Add up every open deal and you get pipeline: the value of everything you might win. It is a useful measure of activity and a poor measure of money, because an early conversation and a contract waiting for a signature count the same. A sales tracker spreadsheet that shows only pipeline will make every month look better than it turns out.
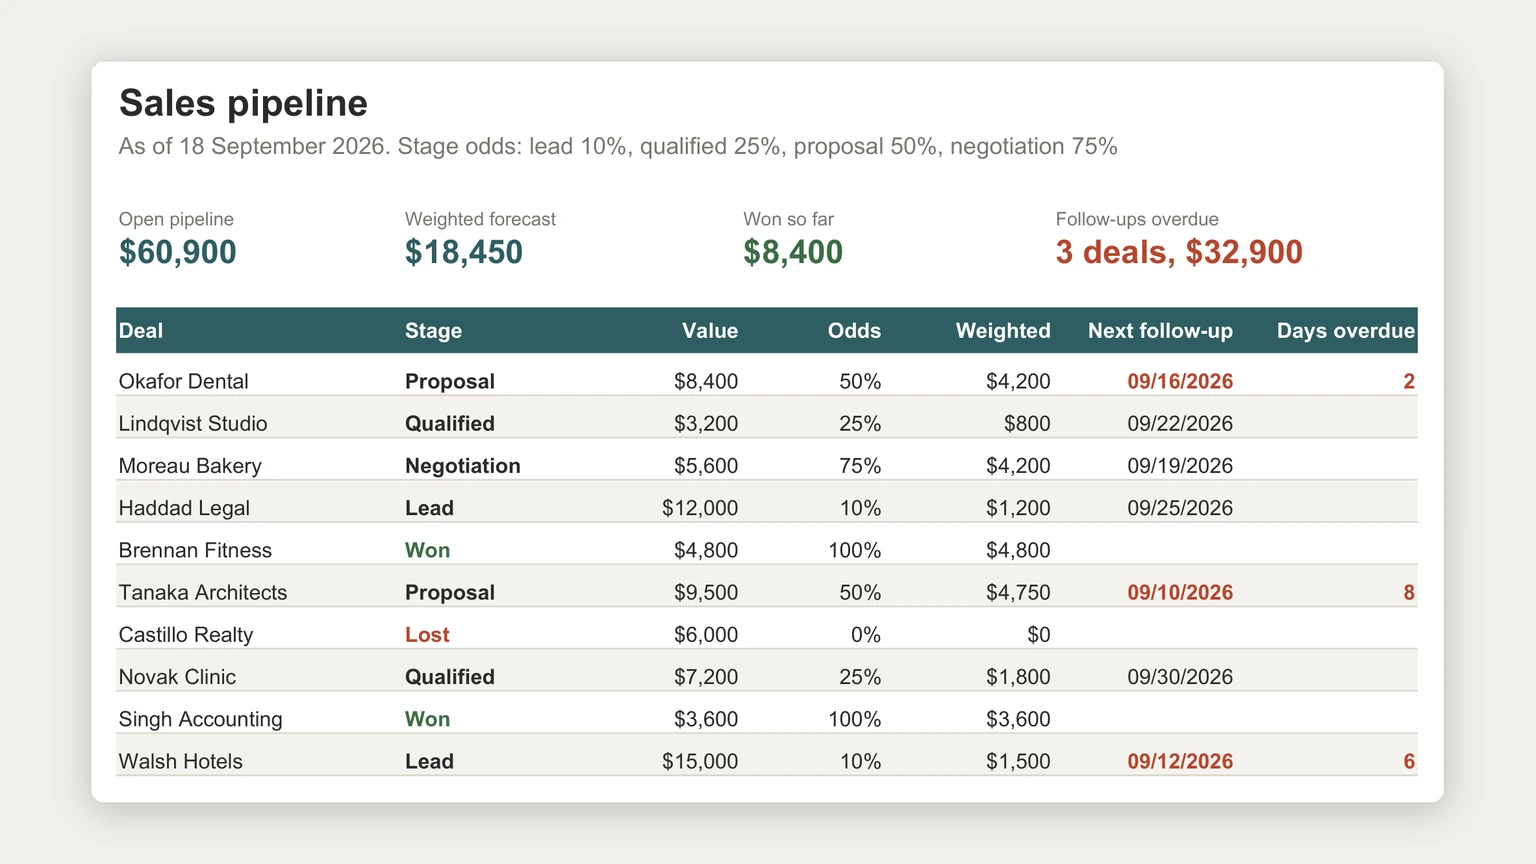
The fix is to weight each deal by how far along it is. The example at the top of this page, ten fictional deals for a small service business, carries $60,900 of open pipeline. Weighted by stage, that is $18,450, less than a third, and much closer to what the next few months will actually bring in.
Stages
Define stages by what the buyer has done
Weighting only works if the stages mean something. Define each one by an action the buyer has taken, not by how you feel about the deal. A lead has shown interest. Qualified means they have confirmed a need, a budget and a rough timing. Proposal means they have your price in writing. Negotiation means they are discussing terms, not whether to buy. Won and lost are closed.
Make the stage column a dropdown so nobody invents a sixth stage called “hot”. Google’s help page on dropdown lists in Google Sheets gives the route: Insert, then Dropdown.
Weighting
The weighted forecast, and where the odds come from
Give each stage a probability. The example uses 10 percent for a lead, 25 for qualified, 50 for a proposal and 75 for negotiation. Each deal’s weighted value is its value times its stage’s odds, and the forecast is the sum of those. With the odds in a small lookup table, the forecast for any stage is one SUMIFS, which Google describes as returning “the sum of a range depending on multiple criteria”.
Treat the starting odds as guesses and replace them with your own history as soon as you have some. Of the deals closed in the example, $8,400 was won and $6,000 lost, a win rate by value of 58 percent. Track closed deals by the last stage they reached and within a quarter you will know your real odds at each stage, which is the most valuable thing this sheet can produce.
Follow-ups
The next follow-up date is the column that matters
Deals rarely die because someone said no. They die because nobody followed up. So every open deal should carry one date: when you will next contact them. A formula beside it shows how many days overdue that date is, and anything above zero turns red.
In the example, three open deals are past their date: Okafor Dental by two days, Walsh Hotels by six, and Tanaka Architects by eight. Together they are worth $32,900. Sort or filter by days overdue each morning and the tracker becomes a to-do list rather than a report, the same habit our Google Sheets to-do list template guide builds for everything else.
Deals rarely die because someone said no. They die because nobody followed up.
Closed deals
Keep lost deals, and say why
It is tempting to delete lost deals. Keep them, with a short reason: price, timing, went with a competitor, never replied. The reasons are how the odds get better, and the lost value is half of the win rate. A tracker that only remembers wins will always overstate how often you win.
Won deals move on to delivery and invoicing. If you buy materials or services to fulfil them, the purchase order template guide covers the other side, and the weighted forecast belongs in the cash-in rows of the cash flow forecast template, shifted to when customers actually pay.
Keeping it alive
Keeping a sales tracker spreadsheet alive
A spreadsheet CRM fails the same way every time: it is set up carefully and updated for two weeks. Keep it small enough to update in the minute after a call. One row per deal, the seven columns in the example, and contact details on a separate tab. Anything that takes longer than that to fill in will stop being filled in. More templates in the same spirit are on our Google Sheets hub.
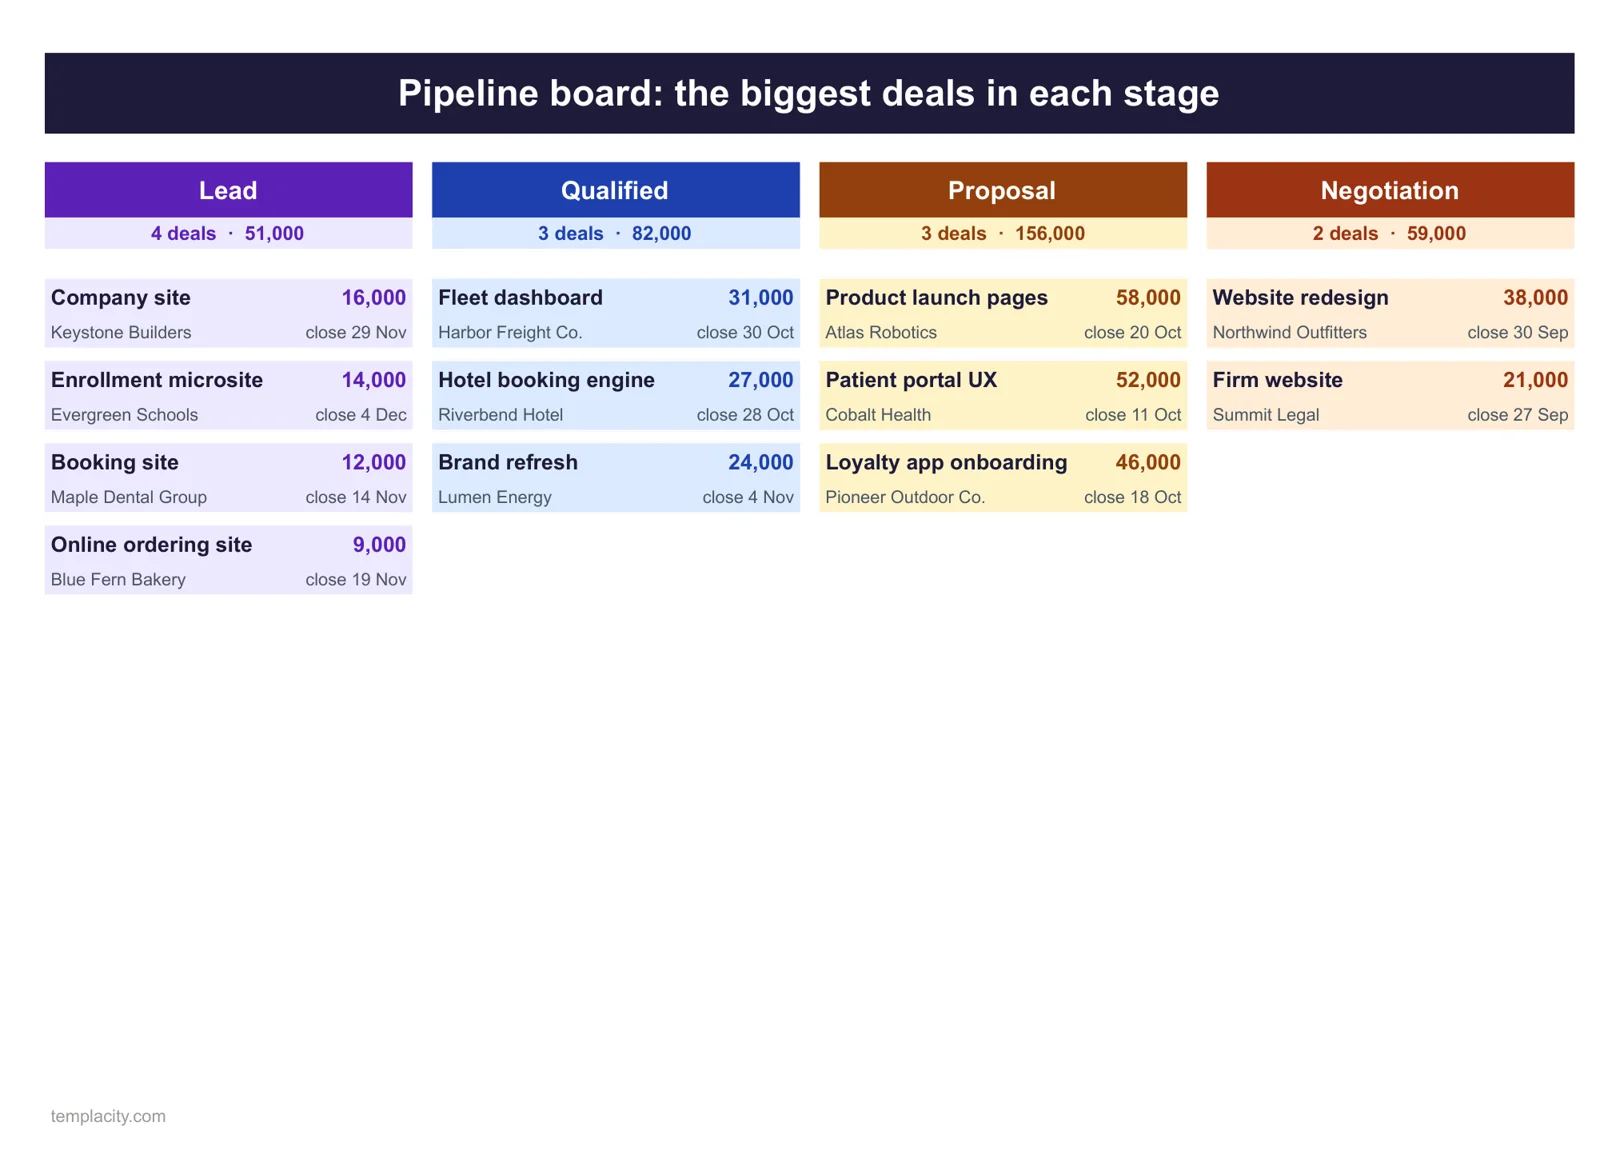
If you would rather start from a finished file, our Sales CRM & Pipeline Spreadsheet ($49, Google Sheets and Excel) lays your deals out as a board by stage and weighs them into a forecast against your monthly target. Contacts turn red after thirty days quiet with a deal still open, and a What If tab shows where the month lands at your own win rate.
A sales tracker that weights its pipeline and dates its follow-ups turns a list of hopes into a plan for the week. Tell us in the comments what odds you use for each stage, and how far your forecast usually lands from what closes; we read every reply.
FAQ
Common questions, answered briefly
What columns should a sales tracker spreadsheet have?
How do you calculate a weighted sales forecast?
What probabilities should each sales stage have?
Is a spreadsheet enough instead of a CRM?
People also ask