Why this matters
What a reading tracker spreadsheet actually has to do
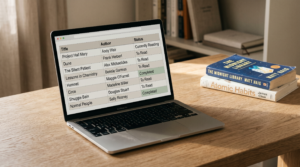
A reading tracker spreadsheet is supposed to do three things, and most of them quietly do five. The three that count: capture a finished book in under a minute, sort the year so you can see what you’ve actually read, and survive past March without making logging feel like homework. The other two things templates often try to do are produce a dashboard worth looking at (which most don’t, because the formulas drift after row 100) and double as a TBR list (which dilutes both functions). If your tracker is doing five jobs and you finished four books in February, the maths is already against you.
The internet sells two different things under the same name. The first is a reading log, which is a date-and-title record of what you’ve read. Logging a book in a reading log takes 30 seconds, which is about the friction budget a reading habit can absorb without breaking. The second is a book journal, which is a per-book record with quotes, themes, ratings, and reflection. Logging in a journal takes ten to fifteen minutes, which most readers underestimate when they download the journal. Confusing these two is the most common reason a reading tracker spreadsheet ends up untouched by April. You picked a journal because the screenshots were pretty, but you only had time for a log.
So the first decision is which one you want. Be honest about the time you’ll actually spend on a normal Tuesday in March, not the time you imagine spending in January with a fresh notebook on your knee. Most readers want a log. Then pick the format. A Google Sheet wins for anyone who reads across multiple formats (paper, Kindle, audio) and wants the count to be portable. A printable PDF wins for paper-first readers who already journal beside the bed. A digital tablet template wins for e-ink readers because logging happens on the same device you finished the book on. This post is about the spreadsheet path; if you read on a Kindle Scribe or reMarkable, our best reading tracker template piece covers the digital-tablet path instead.
Inside the spreadsheet path itself, the cleanest tracker is the one with the fewest fields. Six columns is the working ceiling: title, author, started, finished, rating, notes. That’s it. Genre, format, page count, source, theme, and recommendation are all tempting and all the reason most templates fail. You’ll fill them for three books and skip them for the next nine. The empty cells then feel like incomplete work and the template starts to repel you. Templates that look fully-loaded on the screenshot tend to be the ones built for someone whose reading life isn’t yours. Strip back to what you’ll actually fill.
The five picks
Five free reading tracker spreadsheets that hold up past March
We checked the five reading tracker spreadsheets that get cited most across reading-community threads, Pinterest pins, and book-blog roundups. Each is free, each is Google-Sheets-first (a couple have Excel versions). We rated them on five axes: how fast a finished book gets logged, whether the dashboard math holds past row 100, how the template handles a multi-year archive, whether the phone view is usable, and whether the template makes you fill fields you don’t care about. The list below names the actual options on the SERP, not invented placeholders. If you’ve used another one that survived a full year, drop it in the comments; we update this post when we find new ones worth recommending.
| Spreadsheet | Logging time | Dashboard | Multi-year | Phone usable | Fields |
|---|---|---|---|---|---|
| Elaine Howlin 2026 | 1 to 2 minutes | Auto charts, breaks past row 80 | No, year-tagged file | Cramped on phone | 11 |
| Sarah’s Bookshelves Rock-Your-Reading | 2 to 3 minutes | Dense, surprisingly stable | No, single-year | Hard on phone | 14 |
| SpreadsheetPoint Book Tracker | 45 seconds | Light, clean | Yes, year tab | Workable | 7 |
| InfoInspired Reading Log | 30 seconds | None | Yes, simple | Phone-friendly | 5 |
| Templacity Free Reading Tracker | 30 seconds | Two charts, hold past row 500 | Yes, archive tab | Phone-friendly | 6 |
Elaine Howlin’s tracker is the SERP leader for “reading tracker spreadsheet” and the most aesthetic of the five. The book-blogging audience loves it for good reason: the layout is friendly and the colour palette is calming. Two things to know before copying it. First, the file is year-tagged, which means each January you’ll need to download a fresh copy and migrate by hand; multi-year history lives across separate files, not one archive. Second, the dashboard relies on formula ranges that work for the first 60 to 80 rows and start mis-counting after that. Heavy readers and book-club leaders outgrow it by July.
Sarah’s Bookshelves Rock-Your-Reading tracker is the heaviest of the five and the one we’d recommend for an analytical reader who wants the data. Fourteen fields per book is a lot to fill, but the dashboard rewards you for it: genre split, pace, mood, and a yearly comparison view. The trade-off is the friction. If you read 40 books a year, you’re spending 90 minutes just logging in the tracker. Sarah’s audience is the data-curious reader who treats reading like a season-long fantasy league; if that’s not you, the lighter trackers will hold up better in your hand.
SpreadsheetPoint is the most boringly functional of the five, which is meant as a compliment. Seven fields, a yearly tab, light charts, and a phone view that doesn’t make you pinch and squint. SpreadsheetPoint is run by a team that publishes Google Sheets tutorials full-time, so the formulas are solid and the comments are clear. The downside is the visuals: nothing in the dashboard photographs well, so Pinterest discovery is harder. For practical use, that’s not your problem. For “I want my tracker to look pretty on my screen”, it might be.
InfoInspired is the simplest of the five and the one that survives the longest for the most readers. Five columns, no dashboard, no formulas to break. The trade-off is no analytics at all; you finish the year with a list of titles and dates and that’s the whole record. If you want to know your monthly count, you’ll do it by eyeballing the rows. If you’d rather not see a chart that’s drifting from the truth, the absence is honest. We’ve seen this tracker maintained for three years running by readers who tried the elaborate ones first.
The fifth pick is ours, free, six columns, two charts, archive tab. We made it because we kept testing the other four and finding the same gap: none of them had a “source” column. We address that below in the free-sheet section. Bias disclosure: we sell a fancier paid product (`/product/reading-tracker-template/`) with three design options. The free sheet doesn’t include the paid extras; it’s the working baseline, not a lite version of the product.
Where they break
Where each tracker breaks
Every tracker on that list has a known failure mode. The honest read of the comparison is that none of them is right for everyone; each has a shape of reader it suits, and a shape it doesn’t. The ledger below collects the failure pattern we’ve heard most often for each tracker in book-community threads, Pinterest comments, and the reader emails we get when we ask what didn’t work. Read it as a “if you’re shaped like this reader, skip this tracker”, not as a knock on the maker.
| Tracker | Where it breaks | For which reader | What to do instead |
|---|---|---|---|
| Elaine Howlin 2026 | Dashboard formulas drift after row 80; year-tagged file forces yearly migration | Heavy readers (50+ books) and multi-year tracking | SpreadsheetPoint or Templacity if you want one file across years |
| Sarah’s Bookshelves | 14 fields per book; 90 minutes of logging across a 40-book year | Casual readers who want a log, not a journal | InfoInspired or Templacity if you want under one minute per book |
| SpreadsheetPoint | Visuals are flat; dashboard is honest but not Pinterest-pretty | Readers who want screenshot equity for social | Elaine Howlin or Templacity for the visual layer |
| InfoInspired | No dashboard at all; only the raw list | Readers who want any analytics (monthly count, rating distribution) | SpreadsheetPoint or Templacity if you want a few honest charts |
| Templacity Free | No journal-mode per-book pages; not a fit if you want long-form reflection | Journal-first readers who want a quote-and-theme record per book | Goodreads or StoryGraph for the reflection layer; pair with the spreadsheet for counts |
Three failure modes recur across the field, and they’re worth flagging on their own. The first is the 100-row dashboard. Most templates use absolute formula ranges (A2:A100, etc.) that the maker set up assuming a casual reader; once the rows go past the range, the dashboard quietly under-counts. If you can read formulas, swap them for open-ended ranges (A:A or A2:A) before you start. If you can’t, expect the dashboard to drift after book 60 and treat it as a rough indicator only.
The second is the year-tagged file. Templates that bake the year into the filename or the tab name force a fresh copy every January, and your reading history scatters across files. The fix is to use a single workbook with a “year” column and an archive tab; that’s the structure we use in the Templacity free copy, and it’s the one that compounds over time. Multi-year readers compare 2024 to 2026 in the same workbook without leaving the tab.
The third is the missing “source” column. We’ll restate this because it’s the one piece of advice that changes the most reading-tracker experiences: log who recommended each book, or where you found it, at the time you add it. By June you won’t remember which podcast guest mentioned the title, and you’ll wish you had. None of the five trackers above include a source column by default. Add it. It’s the field you’ll read most when picking what’s next.
Our free sheet
The free Templacity Google Sheets reading tracker
We’re building a free copy you can clone to your own Google Drive: six columns (title, author, started, finished, rating, notes) plus a dashboard tab with two charts (books per month, rating distribution). The “Make a copy” link is coming in the next post update; subscribe to the comments below and we’ll ping you when it lands. In the meantime, the four free options in the comparison above all work, and the steps section below walks through a 20-minute build from scratch if you’d rather know what’s under the hood.
The design choices behind the free sheet are deliberate. We named the rating column “rating” and not “stars” because half of readers think in 1 to 5 and the other half in 1 to 10; “rating” lets you pick. We put “notes” at the end rather than splitting it into “quote” and “theme” and “thought” fields because most readers fill one of those three and leave the other two empty, and one open field stays maintained where three split fields don’t. We left “source” out of the default copy because adding it to the column header invites the question “what counts as a source”, and the answer (“whoever told you about it, in your own words”) fits better in a how-to section than a column header. Add it as a seventh column when you’re ready.
The dashboard tab uses open-ended ranges, so the charts don’t drift after row 100. The books-per-month chart counts finished books by month from the “finished” column; the rating-distribution donut counts ratings. Both refresh as you add rows. There’s no “year” tab; the workbook is meant to be a single file you keep adding to year after year. Filter by year if you want a single-year view. Archive nothing.
If you read more than 50 books a year and want a per-book reflection page (a “journal mode”), the free sheet won’t carry that load. You can add a “notes” column with line breaks, but a real journal page wants formatting and Google Sheets is the wrong medium. For that use case, see our reading-tracker-template product page; the paid version includes journal-mode pages and three design options (Aesthetic, Classic, Dog Lover). If you don’t need the journal layer, the free sheet is the whole picture.
Build it yourself
Building your own reading tracker spreadsheet in 20 minutes
If you’d rather build your own than copy ours, this is the 20-minute version. The point of building from scratch is that you’ll know which fields you actually want, which fields you’ve left out, and what the dashboard is doing. A template you built is a template you’ll maintain, because every column is one you chose. The steps below are tested; we’ve taught this build to three reader cohorts and the median build time is 18 minutes including a tea break.
Open a fresh Google Sheet and name it after the use case, not the year.
Title it “Reading Tracker” rather than “2026 Reading Tracker”. A year-tagged file forces yearly migration; a use-case-tagged file compounds. You’ll thank yourself in January 2028.
Set six columns in row 1: title, author, started, finished, rating, notes.
Skip genre, format, pages, source, theme. You can add them later if you find yourself writing them in the margin. The default six columns cover the working case; everything else is optional and most readers don’t fill it.
Set the rating column to data-validate a 1 to 5 drop-down.
Data → Data validation → Dropdown → 1, 2, 3, 4, 5. The dropdown speeds up logging and prevents typos that break the dashboard’s count later.
Add a second tab named “Dashboard” and insert two charts.
Chart 1: a column chart counting finished books per month (use COUNTIFS on the “finished” column with MONTH conditions). Chart 2: a pie or donut counting ratings (COUNTIF the rating column for each value 1 through 5). Both use open-ended ranges so the charts don’t drift past row 100.
Freeze the header row and turn on filter view.
View → Freeze → 1 row. Data → Create a filter. The frozen header keeps the column labels visible as you scroll past 50 books; the filter lets you sort by rating, author, or year without disturbing the underlying order.
Open the sheet on your phone, log a book, and check the friction.
This is the step most people skip and most should not. If logging a finished book from your phone takes more than a minute, the tracker won’t last. Adjust the column widths and freeze settings until phone logging is comfortable. The first book you log should be the one you finished yesterday.
The whole build is 20 minutes if you go straight through, more like 45 if you wander off and design a colour palette. We recommend going straight through. You can prettify later. The first version of your tracker should be ugly enough that you don’t feel precious about deleting columns from it; the second version, three months in, will know which fields you actually use.
Dashboard math
Reading tracker dashboards: which four charts are useful
The reading tracker dashboard is the visible reward for logging. It’s also where most templates spend their effort and where most readers spend the least time. A dashboard that looks good in a Pinterest pin and breaks at row 80 is a worse dashboard than one with four charts you actually look at in October. The charts below are the ones worth building. Three common ones aren’t on the list, and we’ll explain why.
Books per month. Column chart, twelve bars, refreshed from the “finished” column. This is the chart you’ll glance at in October when you’re wondering whether you’re behind on a vague yearly count. It’s the most honest single view of a reading year, because it shows the shape (the slow February, the strong April, the August dip). Without it, the tracker is a list and the year is a vague shape in your head. With it, the year is legible at a glance.
Rating distribution. Donut or column, five buckets, refreshed from the rating column. The interesting question this chart answers is whether you’re being honest in your ratings. If most of your ratings are 4-star, your scale is broken (you’re using “4” the way someone else uses “3”); the distribution tells you. The chart is also the one that prompts you to drop a book that’s not working; if you’d rate it a 2, finishing it doesn’t earn the slot.
Genre split. Pie or stacked bar, refreshed from the genre column (which you’ll add as the seventh column once you decide you want this chart). The use of the genre split is to surface unintended ruts; if 11 of your 14 books this year are literary fiction, you’ll see it. Some readers care about this, others find genre balance to be a forced metric. Add the chart if balancing genres is a real preference; skip it if you read what you read and don’t want to nudge yourself.
Pages per day, rolling. Line chart, 30-day rolling average, refreshed from a “pages” column. This one is for readers who track minutes-or-pages-per-day as a habit (which we recommend over book counts). The line shows whether the reading habit is steady or has gaps; the rolling smooths out the noise of a heavy weekend or a sick week. If you don’t track pages, skip this chart and use the books-per-month one as your habit indicator.
Three charts to skip. Most-read author until year three: with one year of data, the chart is just whoever you happened to read twice. Wait. Format breakdown (paper vs Kindle vs audio): interesting once, not useful month to month. Diversity metrics without genre tagging: charts that claim to show diversity by author background tend to either be inaccurate (you didn’t fill the data) or feel performative (the chart isn’t doing what you want). If diversity in your reading matters to you, set the goal as a number and check it once a year, not as a perpetual chart.
A dashboard that looks good in a Pinterest pin and breaks at row 80 is a worse dashboard than one with four charts you actually look at in October.Dashboard math
Tablet readers
If you read on a Kindle Scribe or reMarkable
If most of your reading happens on a Kindle Scribe or a reMarkable, the spreadsheet is the wrong format and this whole post has been the long way to tell you that. The friction that kills a tracker habit is the act of opening a different device to log a book you just finished. If you finished the book on a Kindle Scribe, the right tracker is a Kindle Scribe template that lives on the same device; you swipe out of the book, swipe to the tracker, log it, swipe back. Logging takes ten seconds and the habit survives. The same logic applies to reMarkable owners, and to Boox owners running the Kindle app.

Our digital-tablet tracker pieces cover the catalog on each device. For Kindle Scribe owners, the best Kindle Scribe templates piece is the entry point, including a dedicated reading-tracker layout. For reMarkable owners, the best reMarkable templates piece covers the available options. Both pieces are format-pillars for their respective niches; this spreadsheet pillar and the digital-tablet pillar are siblings, not competitors.
If you read across all three (paper, Kindle, tablet), the cleanest combination we’ve seen is a digital-tablet tracker for the books you finish on the tablet, and a Google Sheet for the books you finish anywhere else, with a quick monthly reconciliation. It’s two trackers, which sounds heavier than one, but the friction-per-book is lower than forcing every format into a single tracker that fits none of them. The exception is a reader who reads only paper; for that reader, the spreadsheet is still the wrong format. A printable next to the bedside lamp wins.
The verdict
Decision shortcut
Five quick branches. If you want the prettiest tracker and read fewer than 50 books a year, Elaine Howlin. If you want the data and don’t mind logging time, Sarah’s Bookshelves. If you want the most boringly functional, SpreadsheetPoint. If you want the simplest possible, InfoInspired. If you want our free copy with two stable charts and a multi-year archive, the Templacity sheet (link in section 4). All five are free; the one that survives in your hand is the one that fits the reader you actually are.
Reading habits stretch over years, not seasons; the tracker that earns its place is the one you trust enough to keep opening in October. Tell us in the comments which tracker you’ve actually maintained for more than six months. We trust the long-tail signal more than the screenshot-pretty ones, and the comments are where that signal lives.
FAQ
Common questions, answered briefly
Is there a free reading tracker spreadsheet?
How do you track books in Google Sheets?
What is the best reading tracker spreadsheet for 2026?
Can you track Kindle books in a spreadsheet?
What is the difference between a reading log and a book journal?
Does a reading tracker spreadsheet work for audiobooks?
If yours isn’t above, drop the question in the comments and we’ll add it.
People also ask