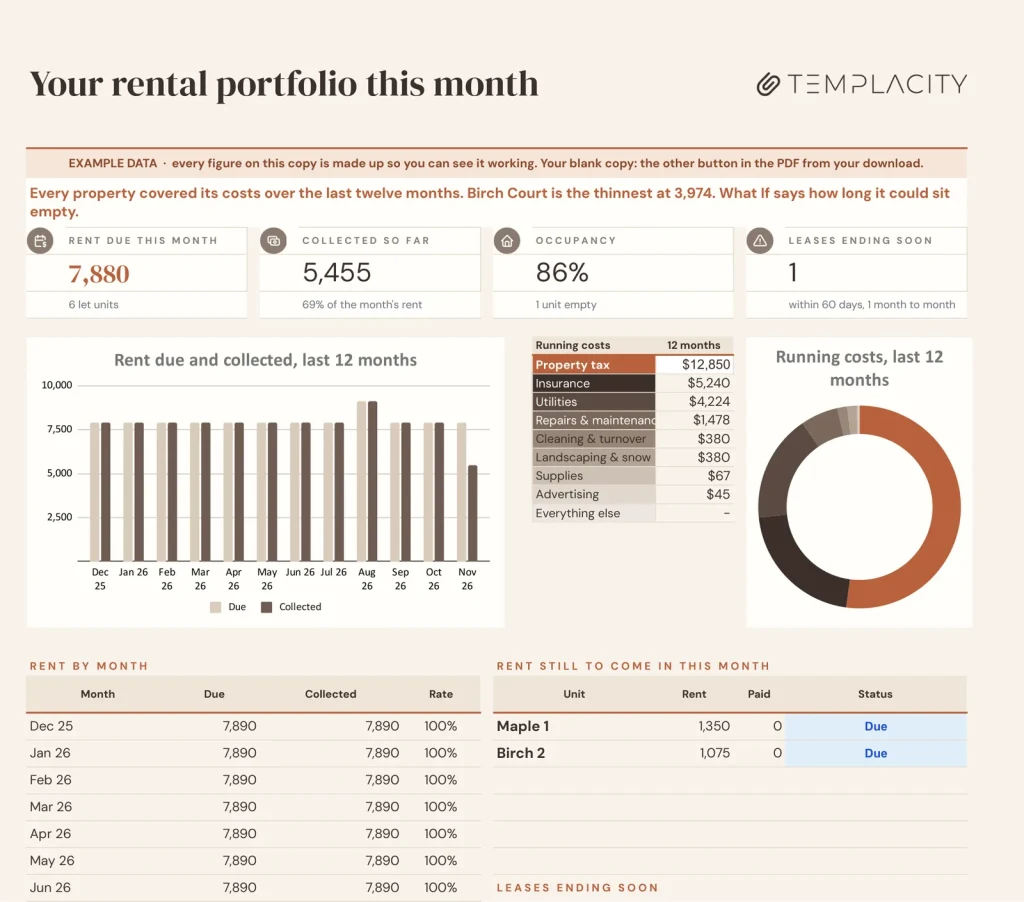
The portfolio: rent due and collected, occupancy, leases ending and every property's cash flow.
Every door, every rent, every month.
Log rent and costs as they happen. The rent roll, the rent tracker and each property's profit and loss work themselves out, and a What If tab says how far the rent can fall before the year turns red.
- Google Sheets
- Excel .xlsx
- Blank + filled example
Language
Instant download. Permanent link in your account.
Instant download. Permanent link in your account. Yours forever, no subscription.
A plain spreadsheet, and this one.
On the left, the plain rent list most people keep. On the right, the Portfolio tab. Drag the line.
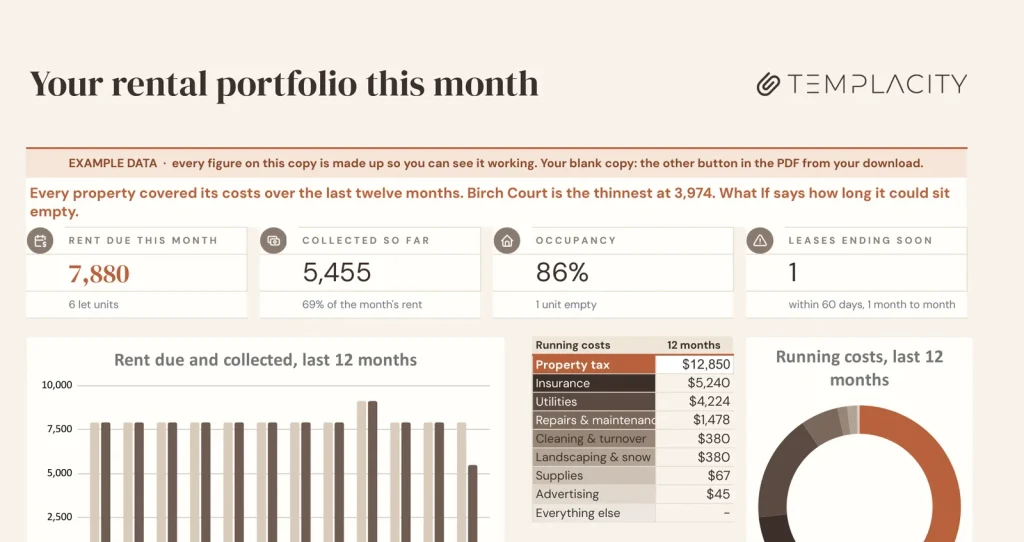
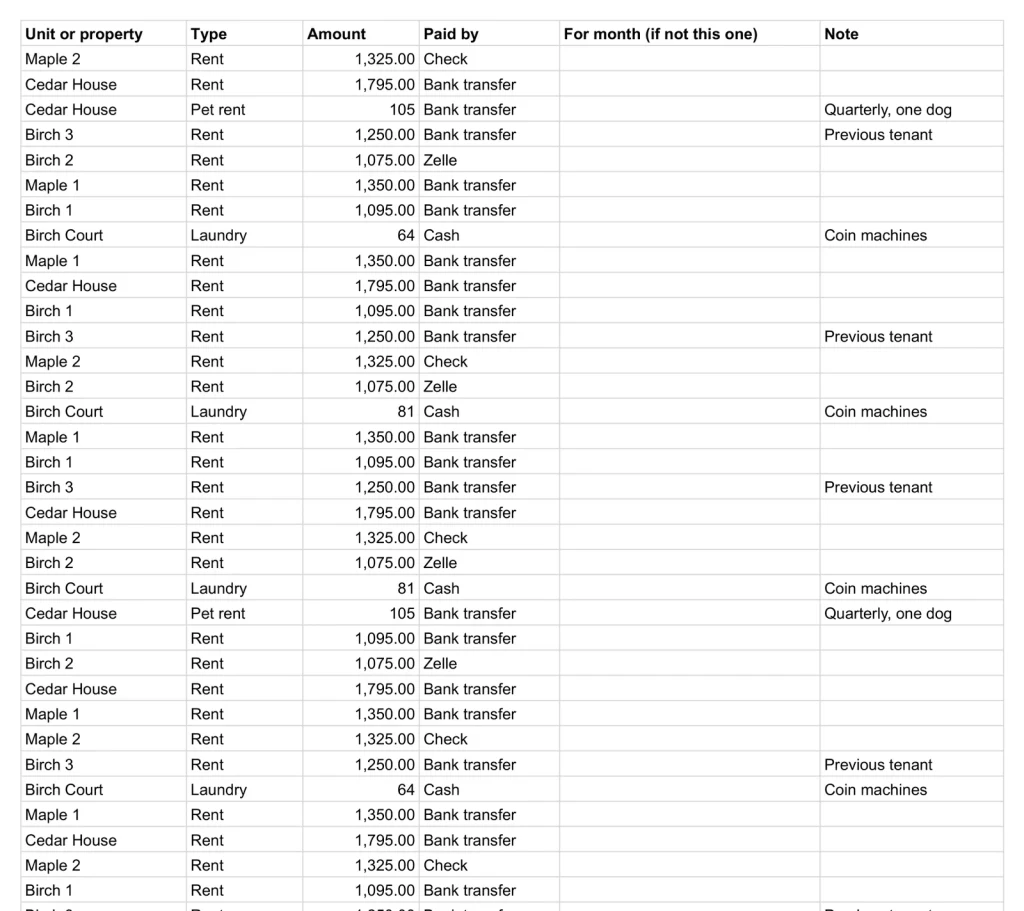
A rent ledger on one side. Every property, what came in and what is owed, on the other.
What If
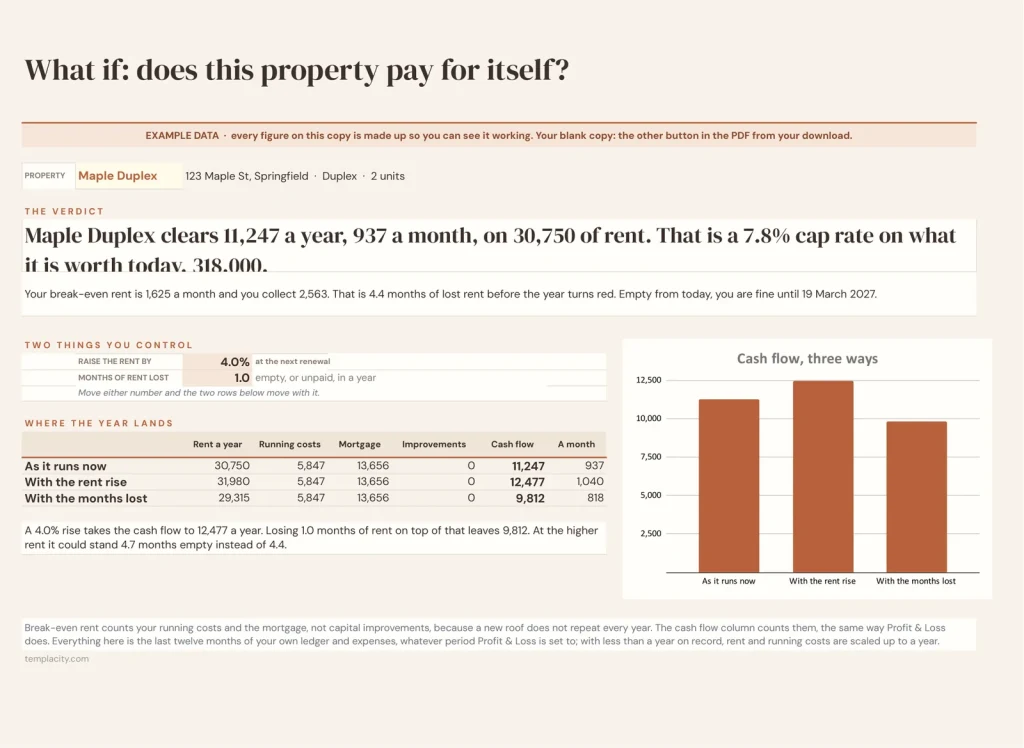
How low can the rent go?
Pick a property and it says the rent it cannot go below, and how many months it could sit empty before the year turns red. Move the rent and watch both move. With less than a year on record, it scales the months you have to a year and says so.
Rent Tracker
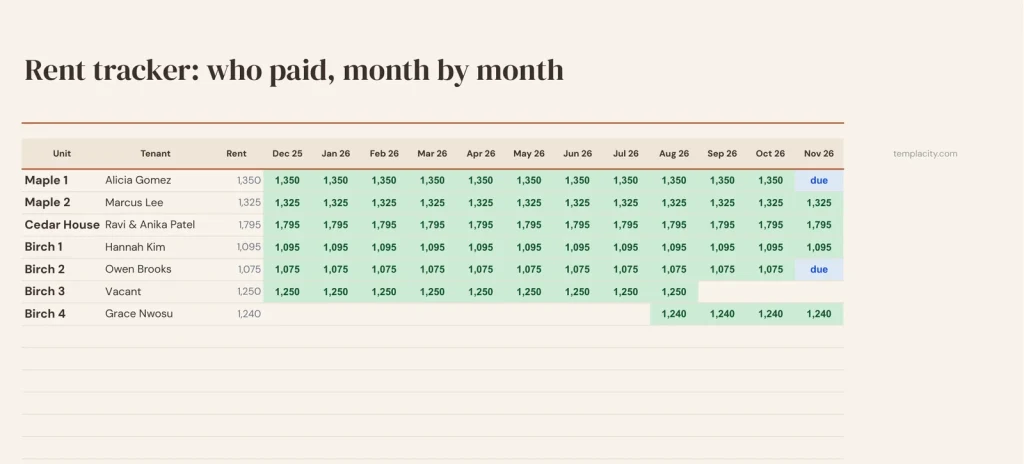
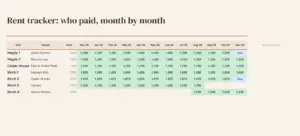
A missed month jumps out.
Every unit against the last twelve months, paid, part paid or unpaid, coloured so a gap cannot hide.
Profit & Loss
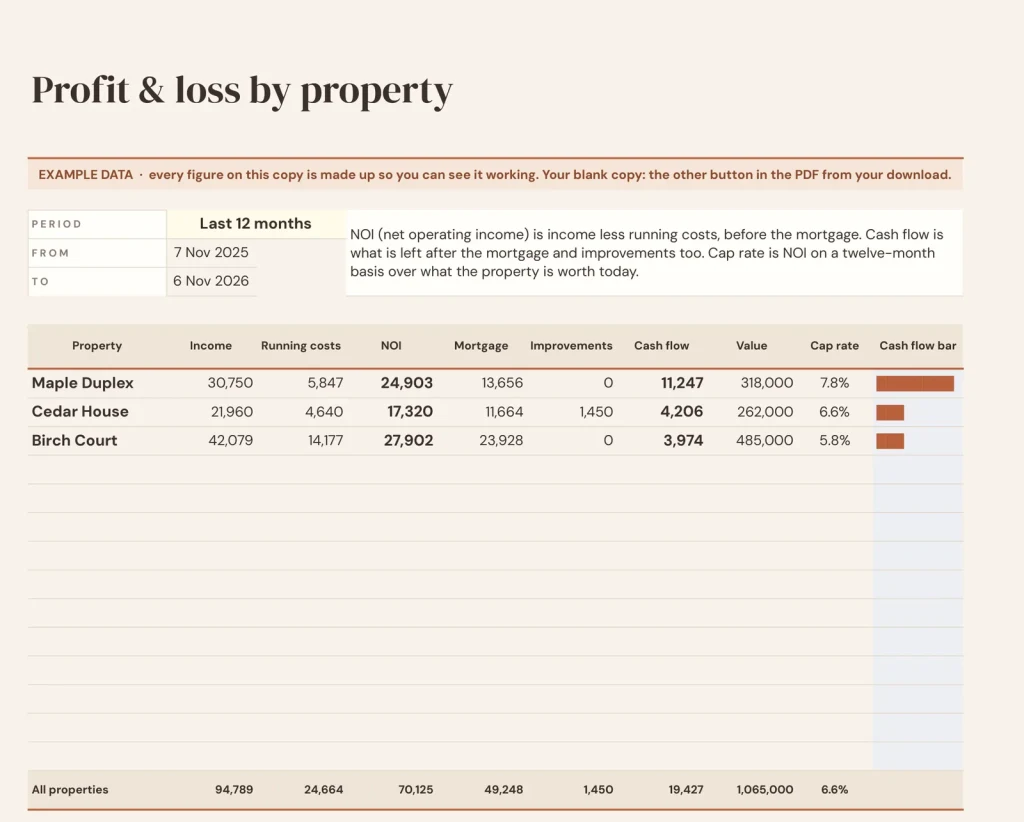
Each property's real result.
Per property for any period: income, running costs, NOI, cash flow and cap rate.
And the quiet ones
Your tenants and your running costs, with a Night edition in Google Sheets.
The rent roll
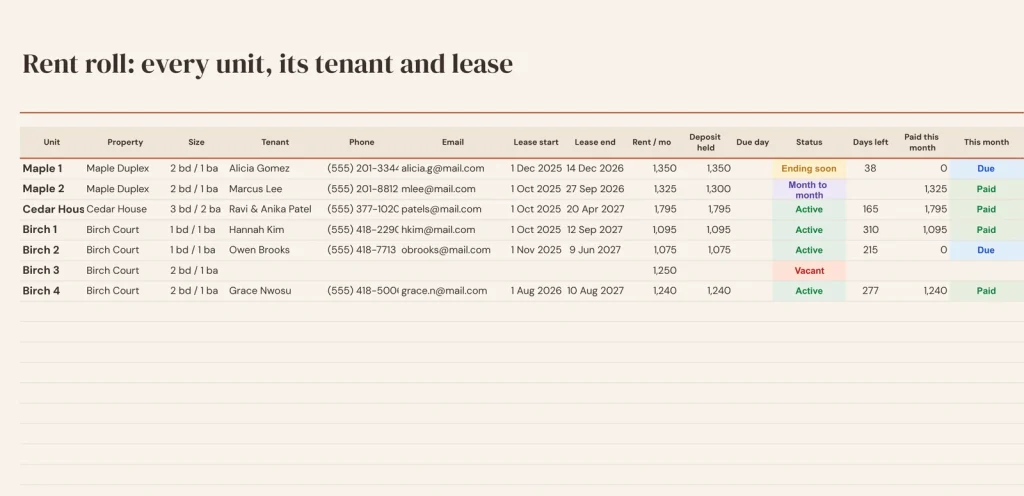
Every unit with tenant, lease dates, rent, deposit and due day, and a status worked out for you.
Where the costs go
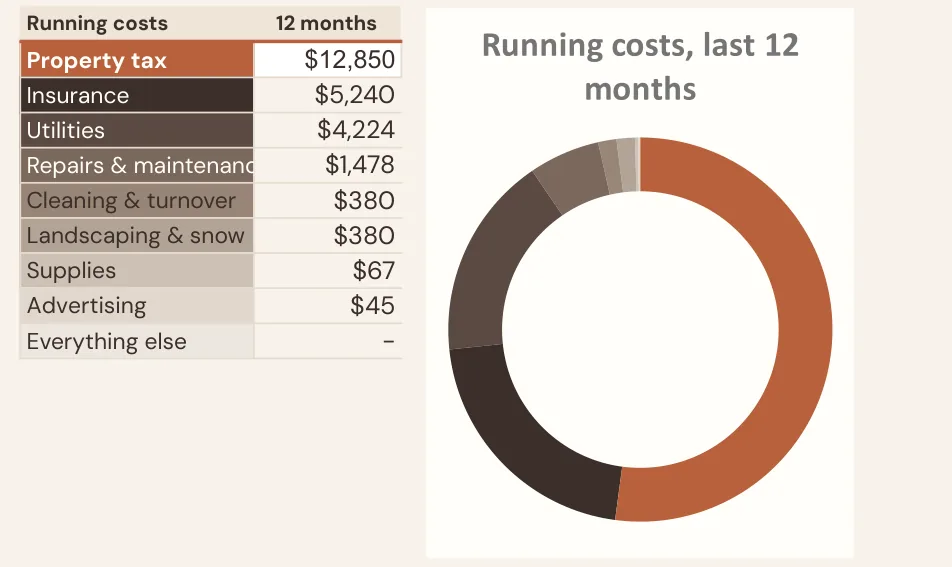
Every running cost ranked by what it takes, in a chart that redraws as you log.
Light or Night
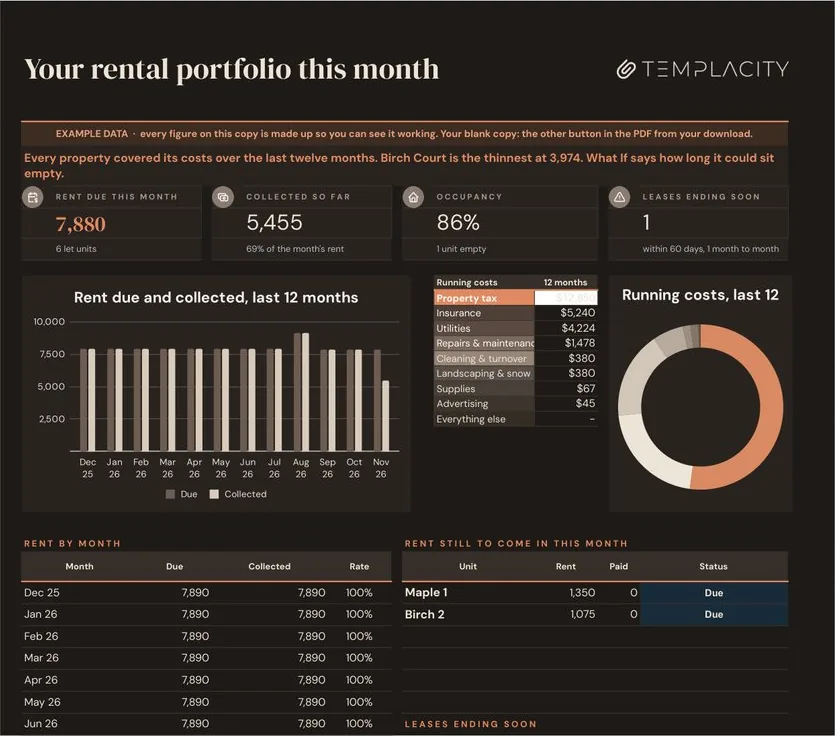
Every Google Sheets copy comes twice: a light edition and a Night edition for dark screens. Same tabs, same formulas; keep the one you like looking at. The Excel files are light only.
You log the rent. It runs the numbers.
You type
- Your properties and units, once
- Rent as it comes in
- Costs against their property
It works out
- Paid and unpaid, unit by unit
- Profit and loss per property
- The lowest rent each one can take
- Leases ending soon
Google Sheets or Excel. You do not have to choose.
The download carries both: the Sheets copy link and the native .xlsx. Every formula is chosen to work identically in the two, and we test the round trip on every build.
A link, not a file to babysit.
Buy it once
$59, no subscription. Your order email and your account both carry the download, permanently.
Copy it into your Drive
One click and it is yours, in your own Google account, forever. We keep no access to your copy and nothing in it phones home.
Start in the example
The filled copy shows every tab already working. Poke it, break it, then open your blank and type your own.
Add the rest of the set.
All three goes in as the Landlord Kit at $109, not three separate items. You keep $38.
№ · Every door, every month
A landlord spreadsheet with a rent roll, a rent tracker and profit and loss per property
The Landlord & Rental Property Manager is for a landlord with a few doors, a duplex up to a small multifamily portfolio, who does not want property management software for it. Start on Properties with what you paid, what each is worth and the loan left, then put every unit on Rent Roll, even the empty ones: tenant, lease dates, rent, deposit and the day rent is due.
The monthly routine
Log each payment on Rent Ledger the day it arrives and each bill on Expenses the day you pay it. Rent Tracker sets every unit against the last twelve months, paid, part paid, unpaid or due, coloured so a missed month jumps out. A late payment for last month goes against the month it pays for. Rent is late after the due day plus five grace days, and a lease inside 60 days of its end shows as Ending soon; both are yours to change.
Does each property earn its keep?
Profit & Loss gives income, running costs, NOI, mortgage, improvements, cash flow and cap rate per property for any period. Deposits are recorded and never counted as income. What If gives a property’s break-even rent and how many empty months it can take before the year turns red. Buy Analysis puts three deals side by side: cash-on-cash against your 6% target, DSCR, cap rate, the 1% rule and break-even occupancy.
The download is a short PDF with two Google Sheets buttons, one for a blank copy in your own Drive and one for a copy filled with an example, the same workbook as blank and example Excel files, and a one-page Quick Start for each.
The questions we actually get
How many properties and units does it hold?
Each building or house is a row on Properties and each unit a row on Rent Roll, so a single family home and a small multifamily sit side by side.
A tenant paid last month's rent this month. Where does it go?
On today's ledger line, with last month in 'For month'. It then fills the right square on the Rent Tracker.
Are security deposits counted as income?
No. They are recorded on the ledger, but the Income? setting keeps deposits received and returned out of income.
How are mortgage payments and improvements treated?
Below NOI. Each expense category is Operating, Debt or Capital on Settings: operating costs count in NOI, the mortgage and improvements come off after it, in cash flow.
Can it help me decide on a purchase?
Buy Analysis compares three deals: mortgage, NOI, cap rate, cash flow, cash-on-cash, DSCR, the 1% rule and break-even occupancy.
Does it work in Excel?
Yes. The download carries native .xlsx files, one blank and one filled with an example, for Excel 2010 and later, Excel for Mac and Microsoft 365. Every formula is ordinary Excel, with no macros to enable.
Is there a year printed in it?
No. No year is printed anywhere in the files, so it starts the day you do and keeps working next year.
The portfolio, kept for you.
Rent, costs and deals, in Google Sheets and Excel, with a Night edition in Google Sheets, no subscription, no year baked in.
Get the manager · $59Still deciding? Open it live, read‑only. Not the sheet you need? See every spreadsheet template or ask at Templacity Hall.
Be the first to say something.
Nobody has written about this one yet. If it is on your device, yours is the first thing the next person reads.
Instant download.
Your file is in your account the moment you check out, yours to re-download any time. A receipt lands in your inbox, too.
One-time purchase.
No subscription, no annual renewal, no upgrade nags. Pay once and the file is yours.
Quiet, secure checkout.
Stripe. Apple Pay. No spam, no “partners,” no reselling your details. Receipt, file, done.