The question
What a cash flow forecast answers that a P&L cannot
A profit and loss statement says whether the business made money over a period. A cash flow forecast template answers a different and more urgent question: will there be enough money in the bank on the day each bill is due? The two only agree when every customer pays the moment you invoice and every supplier is paid the moment you buy, which describes almost no business.
So the forecast is built on dates rather than on earnings. A sale goes in the month the customer actually pays. A supplier bill goes in the month you actually pay it. Our Excel profit and loss template guide covers the other document and why a P&L built from bank transactions is really a cash statement in disguise. This page is the cash statement done on purpose, pointed forward.
The example
A worked example: the best month ends overdrawn
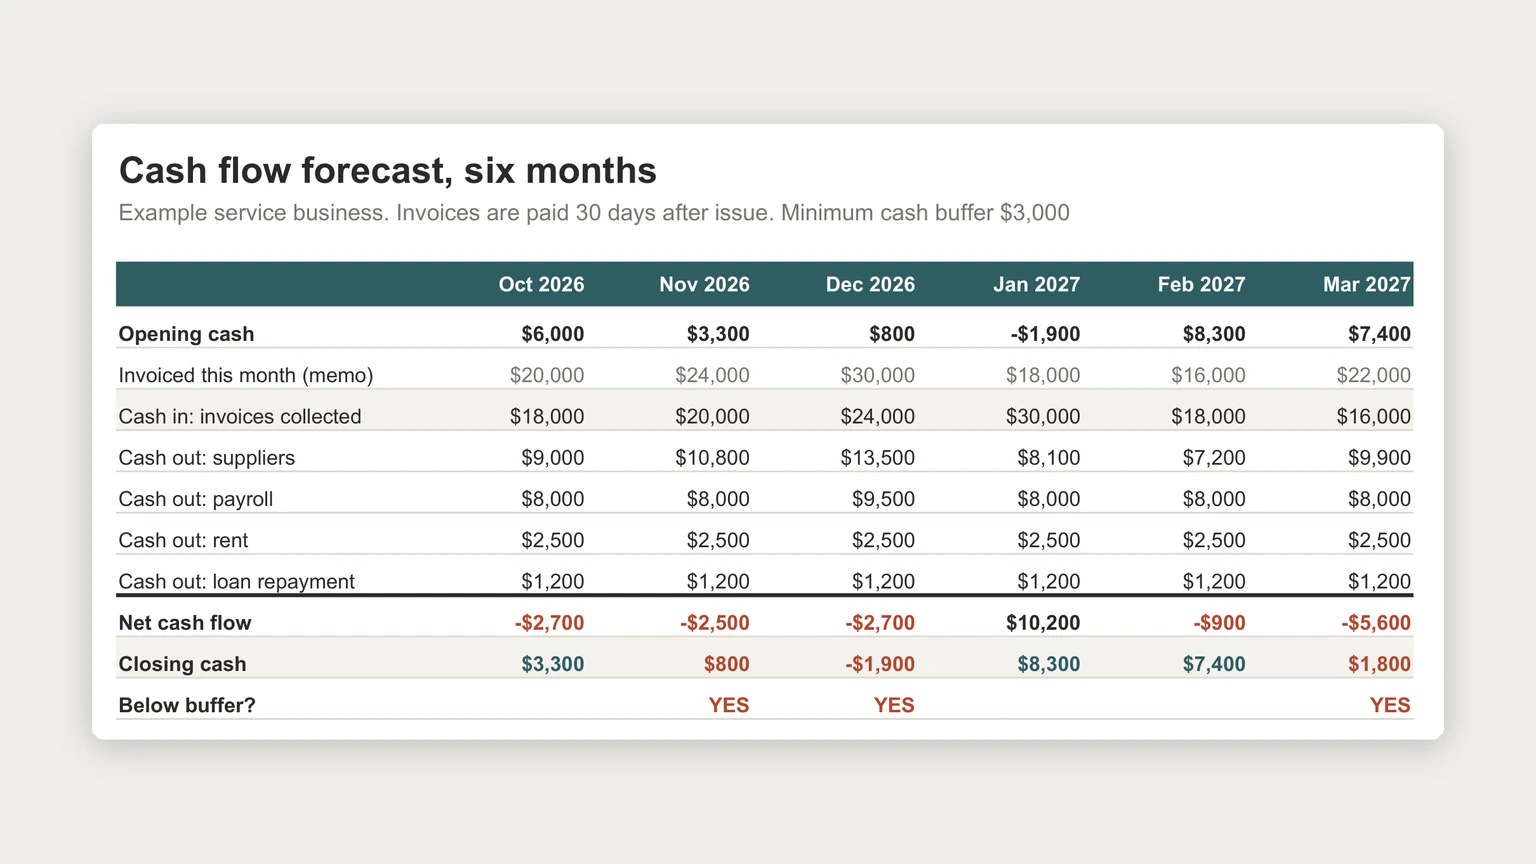
The forecast at the top of this page belongs to an example service business. It invoices customers who pay 30 days later, buys supplies worth 45 percent of each month’s invoicing and pays for them the same month, and carries fixed payroll, rent and a loan repayment. It starts October with $6,000 in the bank and wants never to drop below $3,000.
December is its strongest month. It invoices $30,000, and on a simple invoiced-minus-costs view it makes $3,300, the best result of the half year. It also ends the month $1,900 overdrawn. The $30,000 will not arrive until January, while December’s suppliers, the extra holiday payroll and the rent all leave in December.
January is the mirror image. Invoicing falls to $18,000 and the same simple view shows a $1,800 loss, yet the bank balance jumps by $10,200 because December’s invoices are finally paid. Read only the P&L and you would celebrate December and worry about January. The cash says the opposite.
The rows
The rows every cash flow forecast template needs
The layout is simple and it should stay simple. Months run across the top, and down the side sit five blocks in a fixed order.
-
1
Opening cash
The first month’s opening is your real bank balance. Every later month’s opening is simply the previous month’s closing, by formula, never typed.
-
2
Cash in, by source
Customer payments, cash sales, loan proceeds, owner money put in. One row each, entered in the month the money lands.
-
3
Cash out, by payee
Suppliers, payroll, rent, loan repayments, tax payments, owner drawings. Again, in the month the money leaves, not the month the bill is dated.
-
4
Net cash flow
Cash in minus cash out for the month. It can be negative, and a run of negative months is the early warning.
-
5
Closing cash, against a buffer
Opening plus net. Compare it with a minimum balance you never want to go below, and flag the month when it does.
We also keep invoicing as a grey memo row above cash in. It is not cash, so it adds into nothing, but seeing it beside collections is what makes the timing gap visible in a single glance.
Timing
Timing is the whole model
Almost every error in a cash flow forecast is a timing error. The totals can be right for the year and the forecast still useless, because it puts the money in the wrong month.
Work out how long customers really take to pay, from your own records rather than your payment terms, and shift each month’s invoicing forward by that much. If half pay in 30 days and half in 60, split the row. Do the same on the other side: a supplier on 30-day terms is paid the month after you buy, and quarterly bills such as insurance or tax arrive in lumps that a monthly average hides.
The totals can be right for the year and the forecast still useless, because it puts the money in the wrong month.
If you already keep a budget, it is a good starting point for the cost rows, as long as you re-date each line to when it is paid. Our Excel budget template guide shows the plan-versus-actual layout that the forecast borrows, and the amortization schedule in Excel guide gives you the exact monthly loan payment rather than an estimate.
The buffer
What to do when a month crosses the buffer
The point of flagging a month three months out is that you still have choices. In the example, the forecast flags November, December and March in early October, which leaves time for several ordinary moves.
Bring cash in sooner: invoice on delivery rather than at month end, ask for a deposit on large jobs, chase the slowest payers first. Push cash out later: agree longer terms with a supplier before the busy month rather than during it. Set money aside in the months the forecast shows a surplus, so the lean months are covered from your own cash rather than from borrowing. And if the dip is structural rather than seasonal, the forecast has told you something about pricing or payment terms that no single month would have.
Horizon
Monthly, weekly, and how far ahead
For planning, twelve months by month is the standard shape, and it is what a lender or investor reading a business plan will expect. The SBA’s guide to writing a business plan asks for forecasted cash flow statements over five years, and for the first year to “use quarterly” or even “monthly” projections.
For running a tight month, a thirteen-week forecast by week does a different job. It catches the payroll that lands two days before the big customer pays, which a monthly view averages away. Many small businesses keep both: the twelve-month view for decisions, and a weekly view switched on only when the monthly one shows a month near the buffer.
Keeping it honest
Rolling the forecast forward each month
A forecast is only useful if it is refreshed. When a month closes, overwrite its forecast figures with what actually happened, reset the next month’s opening to the real bank balance, and add a new month at the far end so the view always looks twelve months ahead. Keep the old version as a copy first, so you can see how far each forecast was off and learn which rows you consistently get wrong.
Build the rows as an Excel table and each formula only has to be written once. Microsoft documents that “by entering a formula in one cell in a table column, you can create a calculated column in which that formula is instantly applied to all other cells in that table column”. For more files in the same shape, the Excel templates hub lists what we have written up so far.
A cash flow forecast is the one spreadsheet that can tell you about a problem while there is still time to fix it. Tell us in the comments which month catches your business out each year, and how long your customers really take to pay; we read every reply.
FAQ
Common questions, answered briefly
What is the difference between a cash flow forecast and a profit and loss?
What rows should a cash flow forecast template have?
Should a cash flow forecast be monthly or weekly?
How often should I update a cash flow forecast?
People also ask