It names the month your cash runs out.
Then it puts two futures beside it: cut your running costs, or grow your sales. Twelve months of cash in and out underneath, with runway, break-even and a three-year plan.
Google Sheets · Excel .xlsx · Blank + filled example
Language
Instant download. Permanent link in your account.
Instant download. Permanent link in your account. Yours forever, no subscription. Open it live, read‑only.
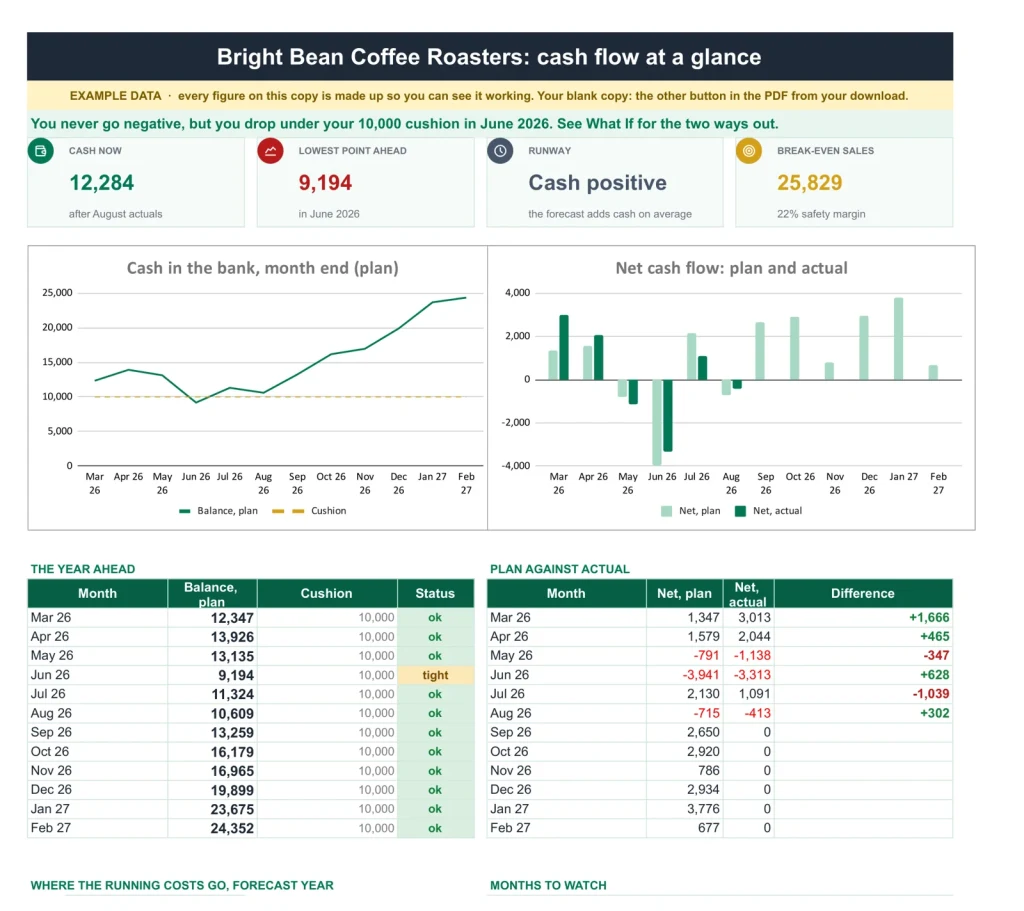
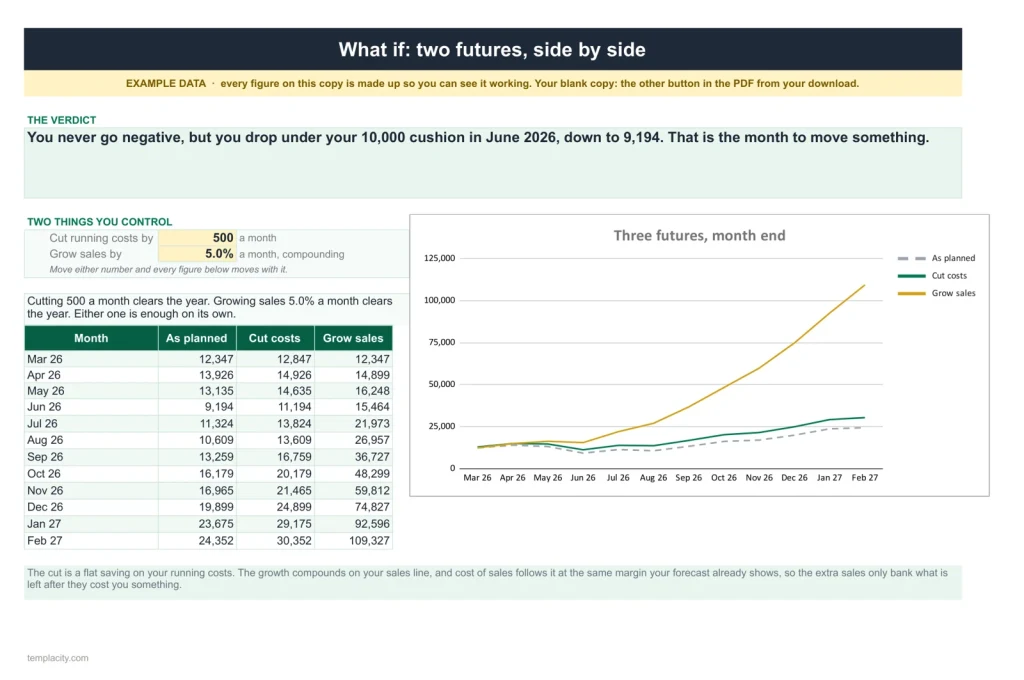
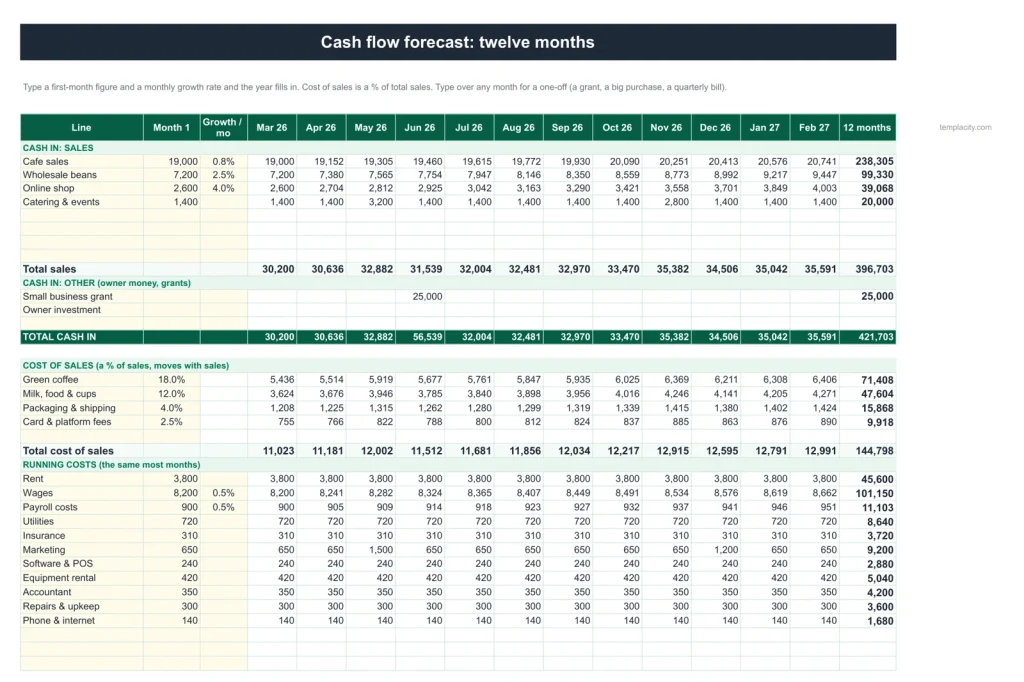
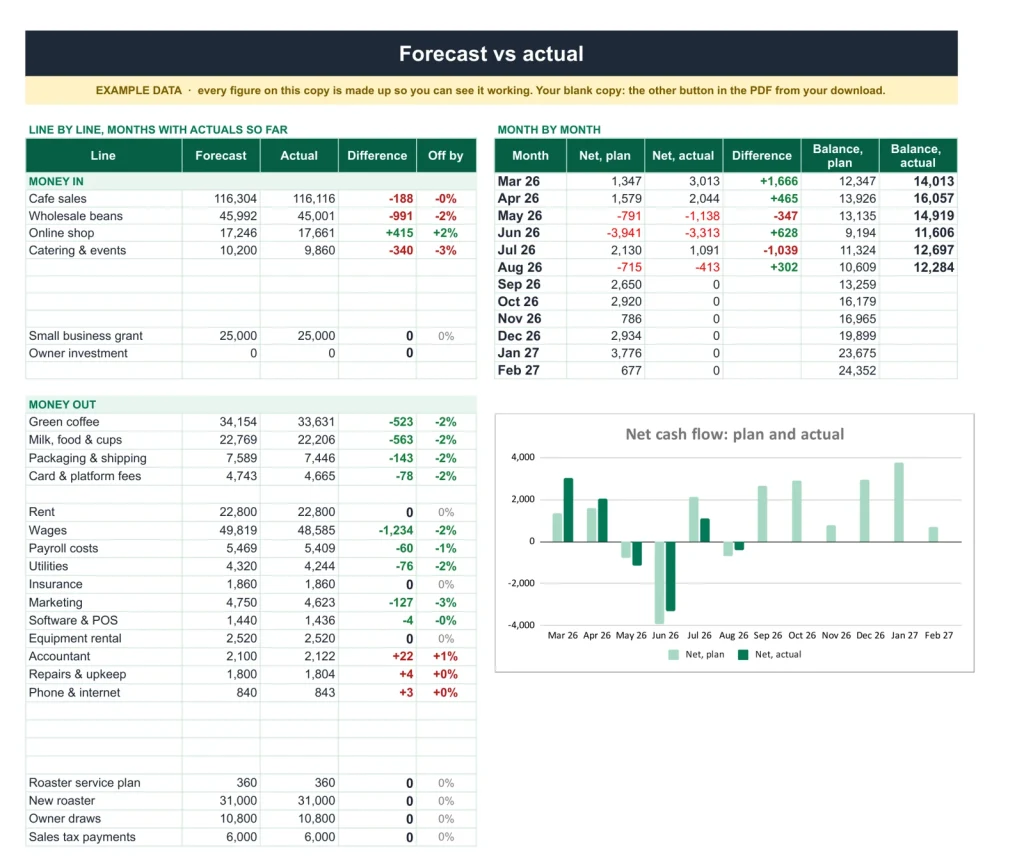
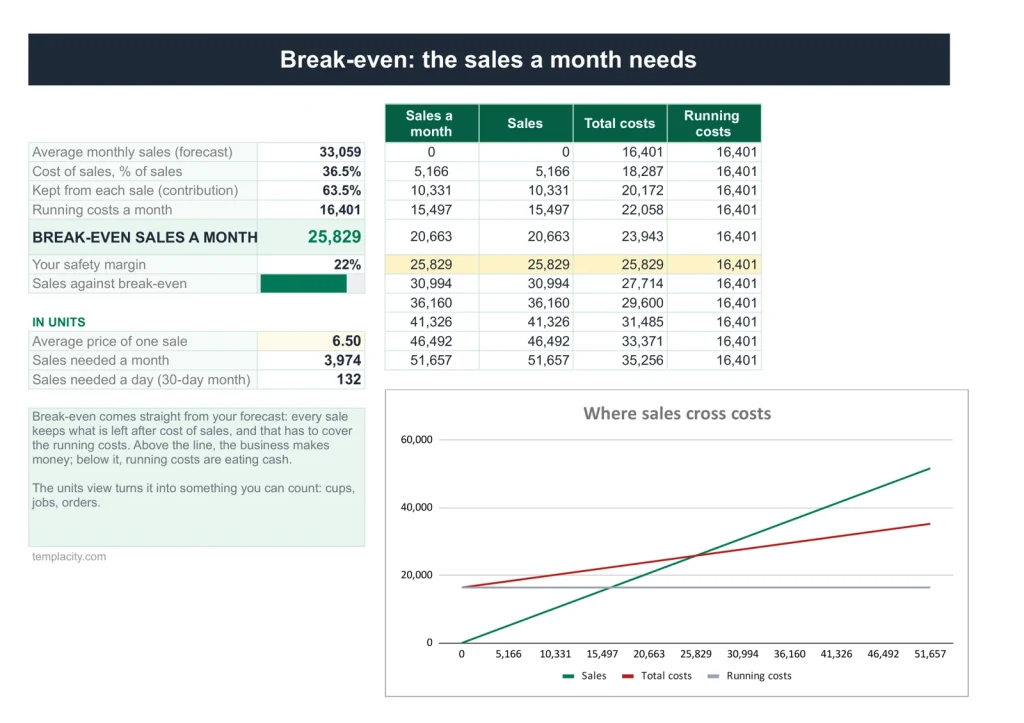
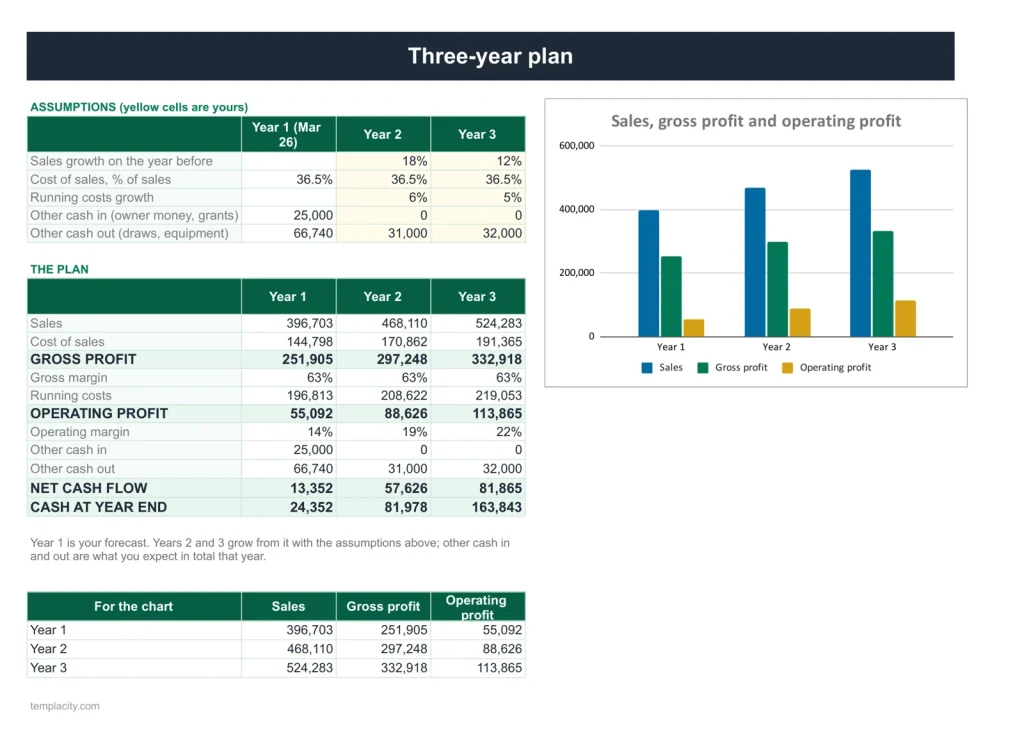
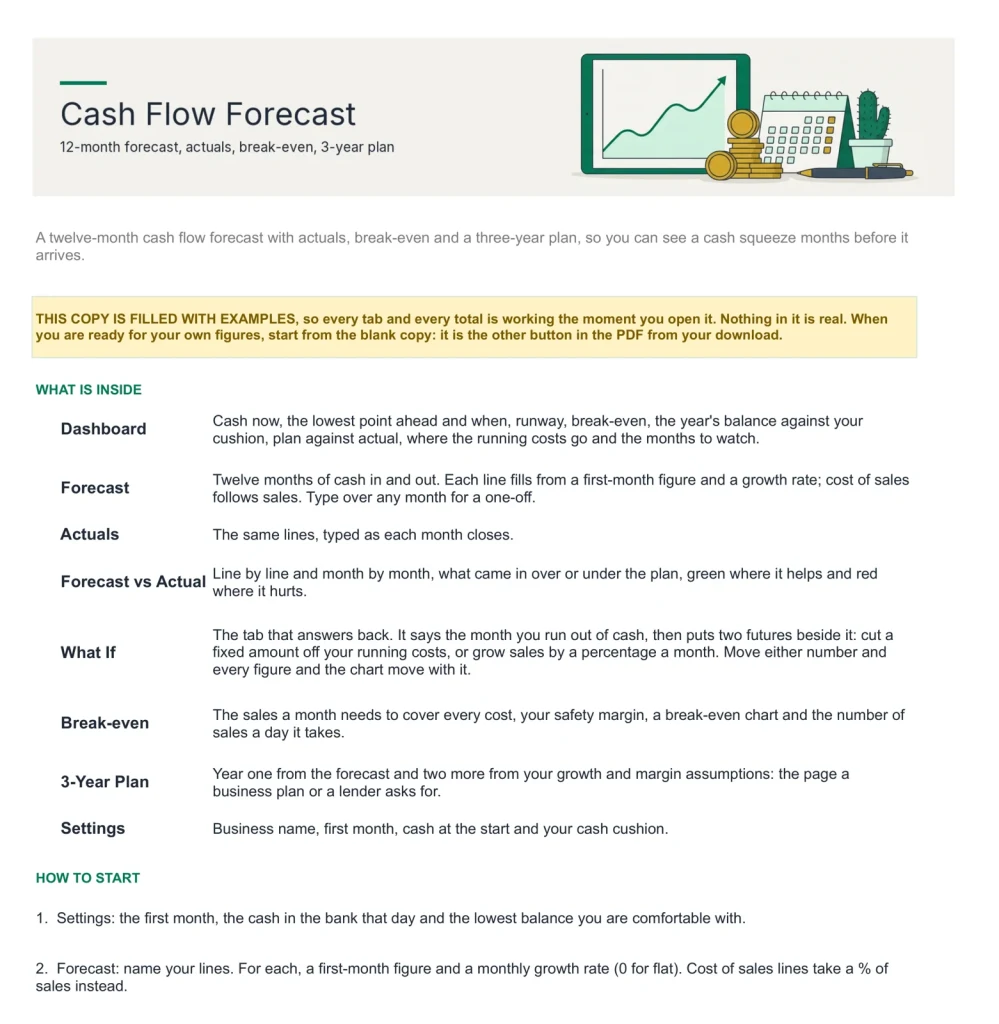
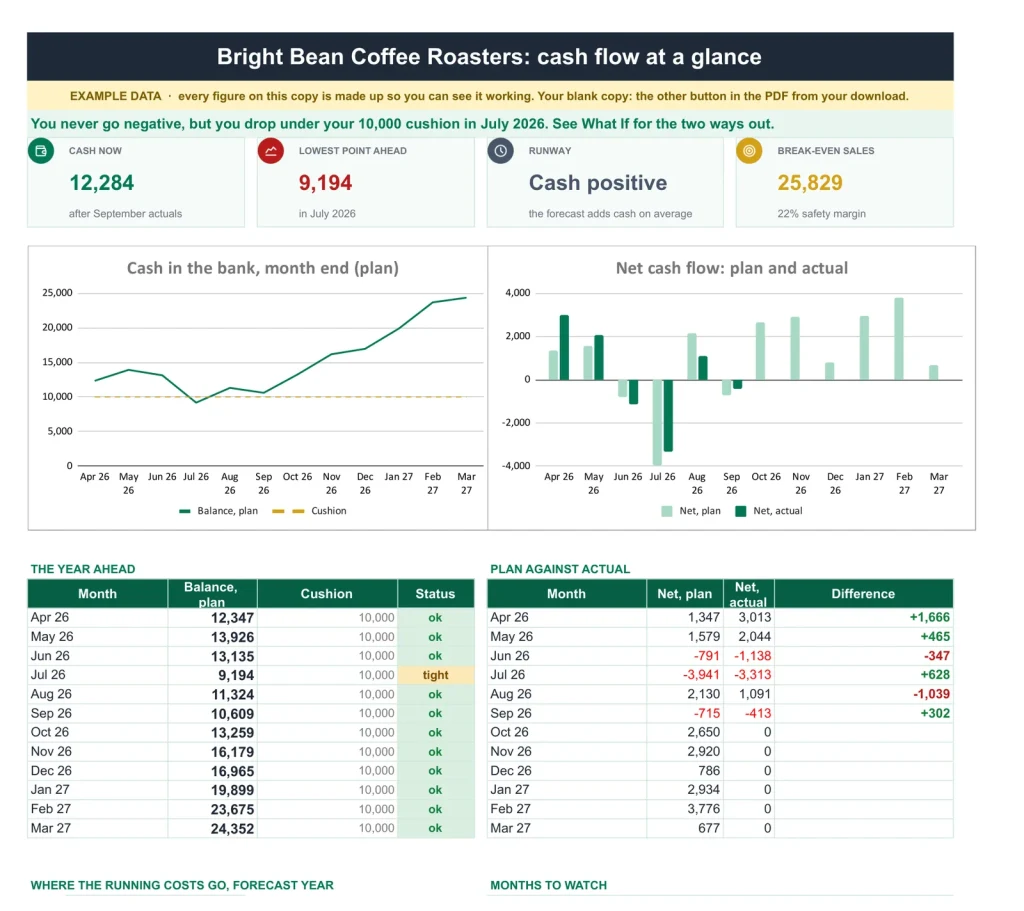
The dashboard: the verdict in one line, then cash now, the lowest point ahead and runway.Two futures, side by side.Twelve months in minutes.Where the plan and the year part ways.Break-evenThe three-year planStart here
You give it a few figures. It reads the year.
You type
- Starting cash and your cushion
- A first-month figure and growth rate per line
- Actuals as each month closes
It works out
- The month cash runs out, in a sentence
- Runway and the lowest point ahead
- Break-even and sales a day
- Plan against actual
A plain spreadsheet, and this one.
Months of cash in and out on one side. The low point ahead and your runway, on the other.
- 1
Buy it once.
₩79,000, no subscription. Your order email and your account both carry the download, permanently.
- 2
Copy it into your Drive.
One click and it is yours, in your own Google account, forever. We keep no access to your copy and nothing in it phones home.
- 3
Start in the example.
The filled copy shows every tab already working. Poke it, break it, then open your blank and type your own.
Four sheets, one routine.
The sales CRM, the project tracker with its Gantt chart, the bookkeeping workbook and the cash flow forecast, together for ₩173,000 instead of ₩250,000. Every one in Google Sheets and Excel, blank and filled with an example.
-
1
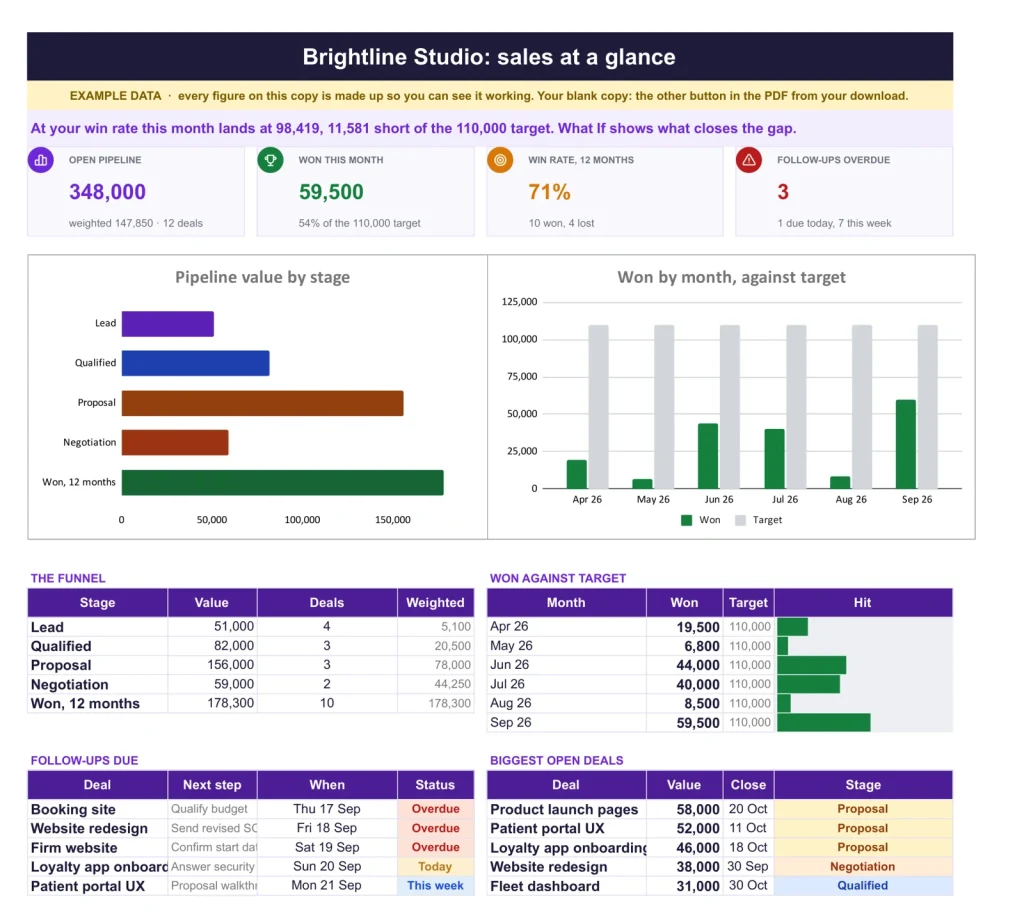
Sales CRM & Pipeline
Know which deal to chase today.
Alone ₩66,000 -
2
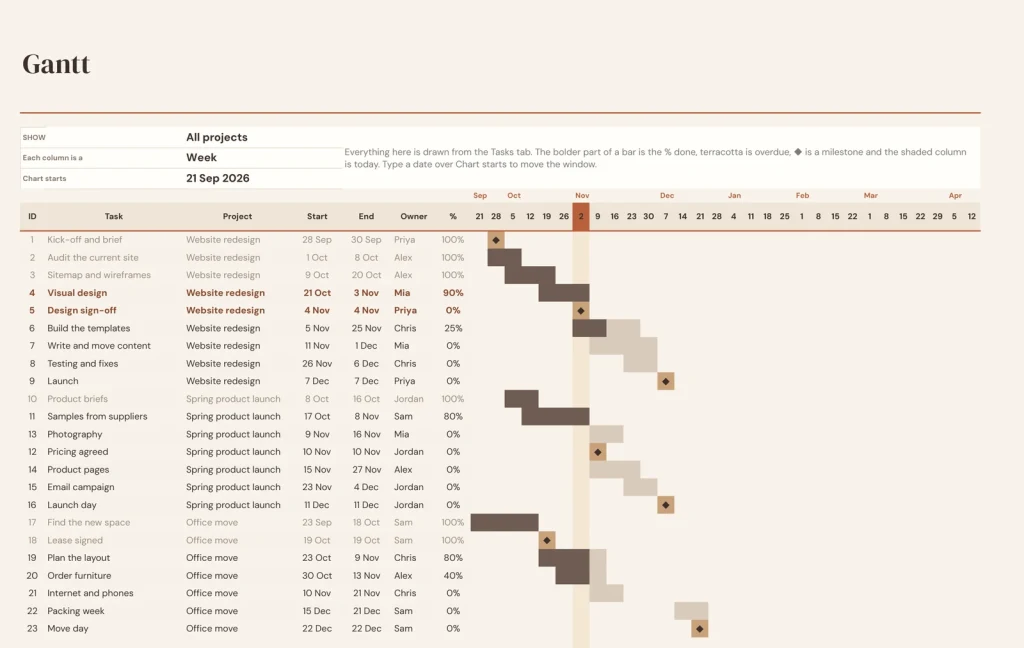
Project Tracker & Gantt
Every job on one chart.
Alone ₩52,000 -
3
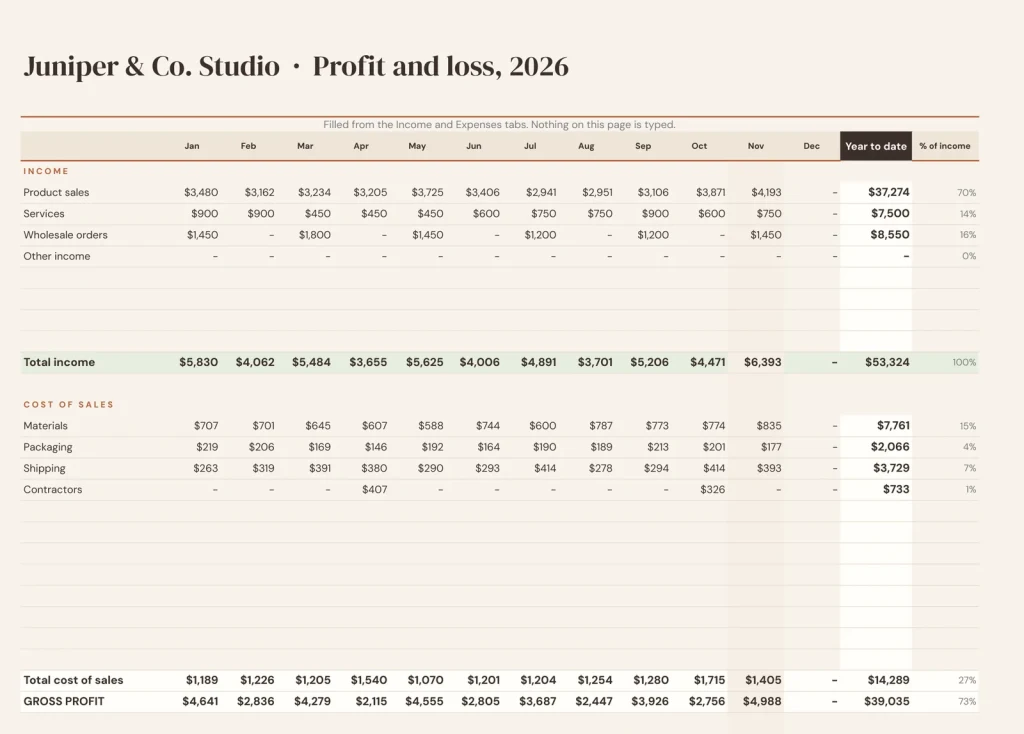
Bookkeeping
The month closes itself.
Alone ₩52,000 -
4 You are here
Cash Flow Forecast
Know the tight month before it comes.
Alone ₩79,000
Separate files that share one routine, each the same file sold on its own page. Also in the Landlord Kit.
№ · See the squeeze before it comes
A twelve-month cash flow forecast that names the month your cash runs short
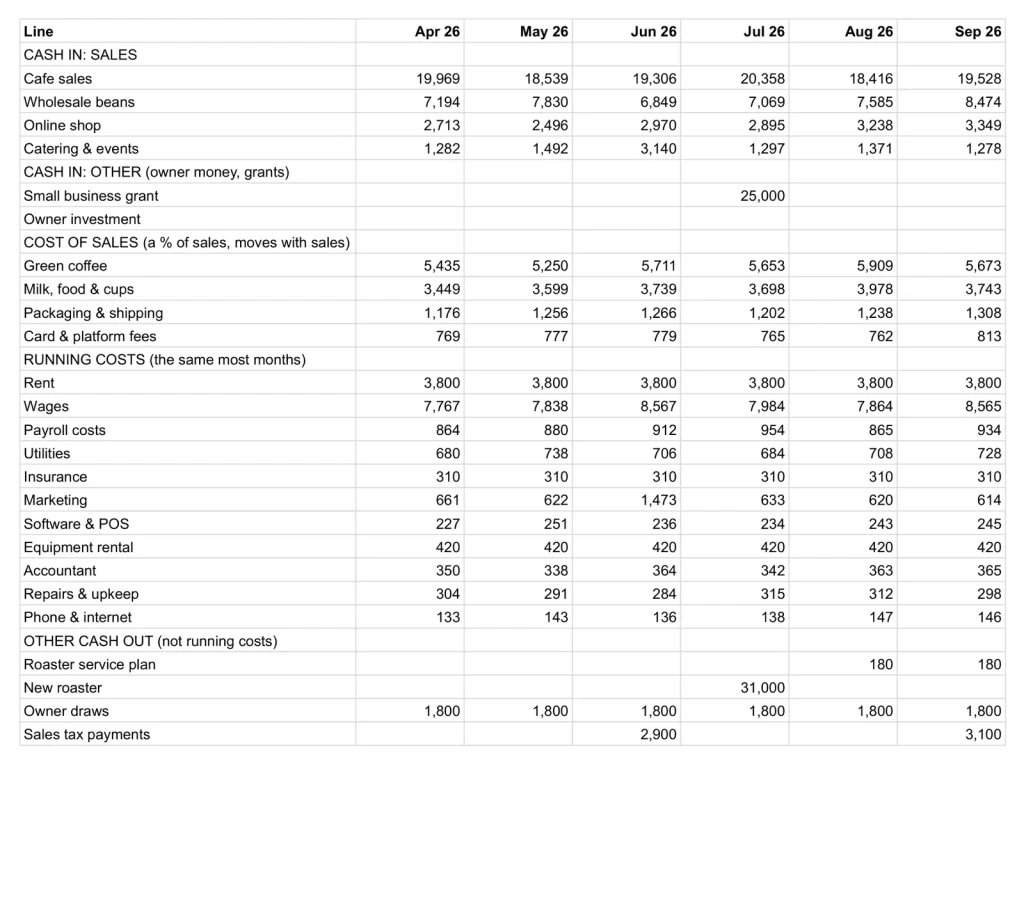
The Cash Flow Forecast is for owners of small businesses who are profitable on paper and still worried about the bank balance. On Settings, type the first month, the cash in the account that day and your cushion, the lowest balance you are comfortable with. On Forecast, name your lines and give each a first-month figure and a monthly growth rate; cost of sales lines take a percentage of sales instead. Type over any month for a one-off, a grant in or a quarterly bill out.
What it tells you
- Dashboard: cash now, the lowest point ahead and when, runway, break-even, and every month forecast below your cushion flagged tight, or SHORT below zero.
- What If: the month you run out, beside two futures, a fixed cut to running costs or a monthly sales growth. Move either number and the chart moves.
- Break-even: the sales a month needs to cover every cost, your safety margin and the sales a day it takes.
- 3-Year Plan: year one from the forecast and two more from your growth and margin, the page a lender or business plan asks for.
Each month end, type the actuals; Forecast vs Actual marks every line over or under, green where it helps and red where it hurts. Cash is not profit: owner money, grants, equipment and draws go in the Other sections, so they move your cash without changing your break-even.
The download is a short PDF with two Google Sheets buttons, one for a blank copy in your own Drive and one for a copy filled with an example, the same workbook as blank and example Excel files, and a one-page Quick Start for each.
The questions we actually get
How do I build the forecast?
Give each line a first-month figure and a monthly growth rate, 0 for flat. Cost of sales lines take a percentage of sales. Type over any single month that is different.
What is the cash cushion?
The lowest balance you are comfortable with. Months forecast below it are flagged tight, and below zero SHORT.
Where do loans, grants and owner draws go?
In the Other sections. They move your cash without changing your break-even, because cash is not profit.
Does it compare the forecast with what happened?
Yes. Type each month on Actuals as it closes, and Forecast vs Actual shows every line over or under the plan, month by month.
Does it work in Excel?
Yes. The download carries native .xlsx files, one blank and one filled with an example, for Excel 2010 and later, Excel for Mac and Microsoft 365. Every formula is ordinary Excel, with no macros to enable.
Is there a year printed in it?
No. No year is printed anywhere in the files, so it starts the day you do and keeps working next year.
See the cliff before you reach it.
A forecast that answers back, in Google Sheets and Excel, no subscription, no year baked in.
Get the forecast · ₩79,000Still deciding? Open it live, read‑only. Not the sheet you need? See every spreadsheet template or ask at Templacity Hall.
Be the first to say something.
Nobody has written about this one yet. If it is on your device, yours is the first thing the next person reads.
Instant download.
Your file is in your account the moment you check out, yours to re-download any time. A receipt lands in your inbox, too.
One-time purchase.
No subscription, no annual renewal, no upgrade nags. Pay once and the file is yours.
Quiet, secure checkout.
Stripe. Apple Pay. No spam, no “partners,” no reselling your details. Receipt, file, done.