What they are
What host reliability standards airbnb actually measures
Host reliability standards airbnb is the platform’s framework for evaluating whether a host is meeting the baseline expectations of guests. Airbnb measures four metrics on a rolling 365-day window: overall rating, response rate, acceptance rate, and host-initiated cancellation rate. Each has a published threshold; falling below the threshold on any metric triggers a warning, repeated falls trigger penalties up to delisting.
The four metrics are not just for Superhost qualification. They feed into the search ranking algorithm (listings with stronger metrics rank higher in equivalent searches), the booking eligibility (some Airbnb features like Instant Book require certain thresholds), and the platform’s deactivation triggers. A listing that drifts below the thresholds is being weighed against deactivation even if the host never set out to qualify for Superhost.
The four metrics
The four metrics and their thresholds
- Overall rating
- Average of all star ratings across the last 365 days. Threshold: 4.6 out of 5 to maintain good standing; 4.8 to qualify for Superhost. Below 4.2, the listing is flagged. Each 1-star review takes meaningful time to recover from on a low-booking unit.
- Response rate
- Percentage of new inquiries and booking requests responded to within 24 hours. Threshold: 90 percent to maintain good standing; near-100 percent to qualify for Superhost. Auto-responses count for the metric but do not satisfy the guest, so use them as a placeholder rather than a substitute.
- Acceptance rate
- Percentage of booking requests accepted (declined requests count against this). Officially Airbnb does not publish a hard threshold; practically, hosts who decline more than 30 percent of requests see search ranking deteriorate. Long-stay requests on calendar conflicts count differently in some markets.
- Host-cancellation rate
- Percentage of confirmed bookings that the host cancels. Threshold: 1 percent over 365 days. On a calendar of 80 bookings per year, one cancellation puts the rate at 1.25 percent and the listing is over the line.
The metric that surprises most experienced hosts is host-cancellation. The 1 percent threshold sounds generous until you do the math: a unit booked 80 nights a year hits 1.25 percent after a single cancellation, and the metric stays over the line for the next twelve months while the cancellation sits in the rolling window. There is no expedited recovery path; the cancellation just has to roll out of the 365-day window naturally.
How to track
How to monitor your host reliability metrics weekly
Open the Performance section
Host dashboard, Performance. The four metrics appear at the top of the page with the current value and the threshold colour-coded. Yellow means within 5 percentage points of the threshold; red means over the line.
Check the rolling-window context
Each metric shows the underlying count, not just the percentage. For host-cancellation, that means the number of cancellations in the last 365 days. The count is the harder number; the percentage moves with denominator changes that can mask a small numerator.
Read the trend, not just the snapshot
Performance shows a 90-day trendline below each metric. A flat 4.7 average rating is healthier than a 4.7 average that started the period at 4.9 and is sliding. The trend is the early-warning system.
Cross-check the response rate against your inbox
Response rate counts the response within 24 hours of the inquiry. If you have multiple listings, the rate is aggregated across all of them; a single 26-hour response on a less-active listing can drag down the metric for the main one.
Log the weekly snapshot
Keep a small log of the four numbers each week. The week-over-week deltas are the signal; the snapshot alone is just a number on a Wednesday. The log is what tells you whether a recent change (a price increase, a new house rule, a slot of difficult guests) is moving the metrics.

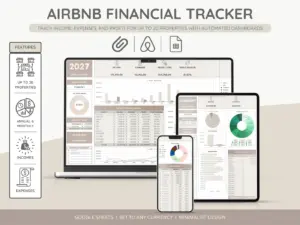

Everything you hand a guest, matched and priced to move together.
Recovering
How to recover when a metric falls below threshold
Recovery looks different for each of the four metrics. Overall rating recovers slowly: every new 5-star review nudges the average back toward the median, but the bad review stays in the 365-day window for a year. The recovery path is more 5-star reviews, not removal of the bad one. Response and acceptance rates recover quickly: a few weeks of disciplined responses and accepted bookings drag the rate back up because the metric is sensitive to recent behaviour.
A single host-initiated cancellation can put a small-volume listing over the line for a year. There is no expedited recovery path.From the metrics section
Host-cancellation rate is the slowest to recover because there is no path to remove a recorded cancellation from the rolling window. The cancellation rolls out 365 days after it happened, and not a day sooner. If the cancellation rate is the metric flagging the listing, the only durable response is to avoid further cancellations and wait the window out. Airbnb does grant exemptions for documented emergencies (medical, government order, natural disaster) but the bar is high and the documentation has to be substantive.
FAQ
Common questions, answered briefly
What are host reliability standards airbnb?
What is the airbnb host cancellation rate threshold?
What is a good airbnb response rate?
Does declining a booking hurt host metrics?
How long do host reliability metrics take to recover?
Can airbnb deactivate a listing for missing reliability standards?
If yours is not above, drop the question in the comments and we will answer it under the next Airbnb piece.
People also ask